By Pam Martens and Russ Martens: February 22, 2023 ~
The Dow Jones Industrial Average plunged 697 points by the closing bell yesterday, wiping out all of its gains this year. Here’s a rundown of what happened.
At 2 p.m. ET today, the Federal Reserve will release the minutes of the Federal Open Market Committee (FOMC) meeting it held on January 31 and February 1. The stock market is particularly skittish on the day prior to the release of those minutes, out of concern that an overly hawkish tone on interest rates will tank stocks.
Given that skittishness, all the stock market needed for a major selloff was a trigger. It got that when Bloomberg News published this headline at 1:36 a.m. in the morning: Morgan Stanley Says S&P 500 Could Drop 26% in Months.
Morgan Stanley’s opinion matters for two main reasons: it has just shy of 16,000 stockbrokers (a/k/a “Financial Advisors”) who typically pitch the firm’s playbook to their clients; and it is a major prime broker to hedge funds who will get a boost from a negative outlook if they are shorting stocks.
The gist of the negative sentiment coming from an analytics team at Morgan Stanley, led by Michael Wilson, is this according to the Bloomberg article:
“While recent data suggest the economy might be able to dodge a recession, they’ve also taken the possibility of a Federal Reserve pivot off the table, according to a team led by Michael Wilson. That doesn’t bode well for stocks as the sharp rally this year has left them the most expensive since 2007 by the measure of equity risk premium, which has entered a level known as the ‘death zone,’ the strategist said.”
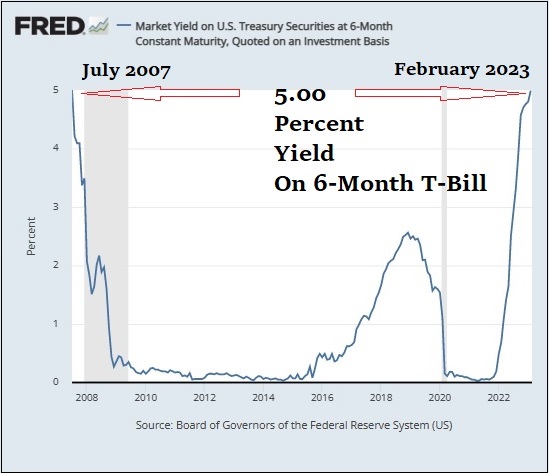
Another problem for stocks is that yields on some U.S. Treasury securities are at the highest level in more than 15 years. Take a look at the chart above. It shows that the 6-month U.S. Treasury bill is currently yielding more than 5 percent, a situation that last occurred in 2007. Not to put too fine a point on it, but 2007 marked the beginning of the worst financial crisis since the Great Depression. By September 2008, century-old names on Wall Street were blowing up and leaving their shareholders with unprecedented losses.
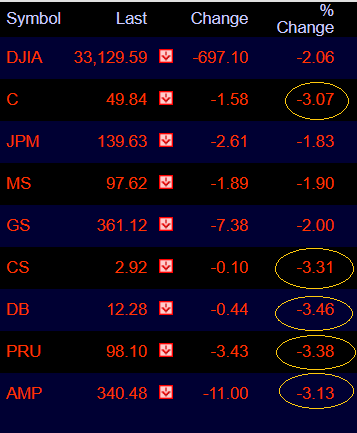
Speaking of Wall Street, below is a chart showing how some key mega banks and insurance companies fared in the market selloff yesterday. We’ve put a yellow circle around those showing losses at the close of 3 percent or greater – a hint that contagion from Credit Suisse and interconnected derivative counterparties might be coming into play. (Ticker symbols are as follows: C – Citigroup; JPM – JPMorgan Chase; MS – Morgan Stanley; GS – Goldman Sachs; CS – Credit Suisse; DB – Deutsche Bank; PRU – Prudential Financial; AMP – Ameriprise Financial.) For more background on this subject, see our report from last year: Fed Chair Powell Telegraphs the Perfect Storm for Wall Street’s Megabanks: Rapid Rate Hikes Hitting $234 Trillion in Derivatives.
Credit Suisse is looking a lot like Citigroup looked in the financial crash of 2008. In 2008, Citigroup’s stock price was in collapse and it had been lying to investors about its exposure to subprime debt. In the current situation, Credit Suisse’s stock price has erased all of its gains going back approximately four decades and its Chairman, Axel Lehmann, is under investigation by the Swiss financial regulator, FINMA, for potentially lying about the run on the bank’s assets being over.
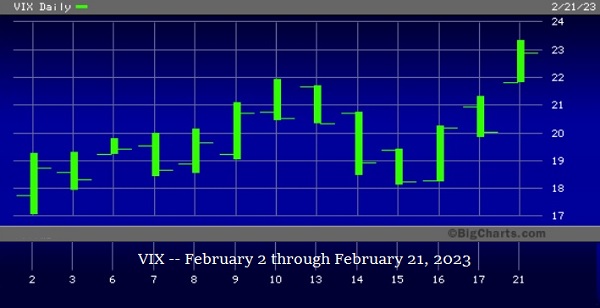
There was also negative sentiment coming from an upward move in the VIX yesterday. The VIX (a/k/a the CBOE Volatility Index), telegraphs the market’s expectations for near-term price changes in the S&P 500 stock index. It is also known as the “fear index.” The VIX typically rises when stock prices fall and fear increases. It has been on an upward trajectory since February 2.