
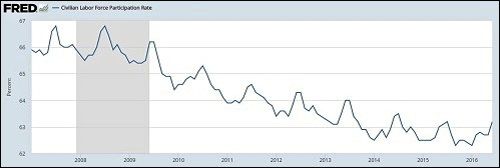
Civilian Labor Force Participation Rate, January 2007 to June 2016 (Graph Courtesy of St. Louis Federal Reserve; Shaded Area is Great Recession)
By Pam Martens and Russ Martens: August 5, 2016
The Bureau of Labor Statistics (BLS) released its nonfarm payroll data this morning, showing that 255,000 jobs were created in July. The unemployment rate remained at 4.9 percent. May data was revised up from the eyebrow-raising low number of 11,000 jobs to 24,000 jobs while June was also revised upward from 287,000 jobs to 292,000. That brought the monthly average to 190,000 jobs over the past three months.
Unfortunately, drilling down into the more granular details, a far less rosy picture emerges; a picture which is far more consistent with an economy feeling the continued weight of unprecedented wealth and income inequality; a picture that is far more correlated to an economy where “58 percent of all new income since the Wall Street crash has gone to the top 1 percent,” to quote Senator Bernie Sanders.
The data for July shows that the U-6 unemployment number is 10.7 percent of the nation’s workforce, more than double the official number of 4.9 percent. The U-6 unemployment rate includes the number of people unemployed; plus individuals just marginally attached to the labor force; plus those employed part-time for economic reasons. (The Bureau of Labor Statistics provides the following definition of marginally attached: “Persons marginally attached to the labor force are those who currently are neither working nor looking for work but indicate that they want and are available for a job and have looked for work sometime in the past 12 months. Discouraged workers, a subset of the marginally attached, have given a job-market related reason for not currently looking for work.)
But a far bigger problem with the BLS data is what constitutes an “employed” worker to our Federal government’s numbers crunchers. According to the Bureau of Labor Statistics, you could be an out of work MBA graduate but if you help your brother in his deli for 15 hours in a week while living in his home, you’re counted as employed. (The BLS says that a worker who makes no money at all donating his or her services to a family business for 15 hours or more per week is considered employed.)
Let us translate that twisted logic a bit further: you may have no equity stake at all in this business; you may never expect to reap a dime for your labors; you may not even get paid for your gas traveling to and from the family business – but your government considers you employed.
Or, if you’re not working for a family member making no money at all but earn at least $20 working for a stranger for at least an hour in a week – you’re counted as an employed worker. You could be an out of work electrical engineer who installs a smoke alarm for the elderly woman next door and accepts $20 for your gesture of help; you now have a job in your government’s view.
You don’t have to take our word for this Alice in Wonderland logic. Here’s the exact language from the Bureau of Labor Statistics web site:
“People are considered employed if they did any work at all for pay or profit during the survey reference week…
“Garrett is 16 years old, and he has no job from which he receives any pay or profit. However, Garrett does help with the regular chores around his parents’ farm and spends about 20 hours each week doing so.
“Lisa spends most of her time taking care of her home and children, but she helps in her husband’s computer software business all day Friday and Saturday.
“Both Garrett and Lisa are considered employed. They fall into a group called unpaid family workers, which includes any person who worked without pay for 15 hours or more per week in a business or farm operated by a family member with whom they live. Unpaid family workers comprise a small proportion of total employment. Most of the employed are either wage and salary workers (paid employees) or self-employed (working in their own business, profession, or farm).”
This helpful-to-the-administration-in-power rosy interpretation of the unemployment rate helps to explain how the U.S. economy could be showing a robust growth in jobs while simultaneously reporting an abysmal labor force participation rate.
In January 2007, prior to the onset of the greatest financial crash since the Great Depression, the labor force participation rate stood at 66.4 percent. In other words, 66.4 percent of all persons aged 16 and older were working. Today, six years into the so-called recovery stage, the labor force participation rate is only 62.8 percent as of last month. Prior to this “recovery” period, you have to reach back to 1978, almost four decades ago, to find such a low labor force participation rate.
And the explanation can’t be passed off to the retirement of baby boomers. According to the latest release from the BLS, in January 2007, 91.5 percent of men aged 25 to 54 were gainfully employed in the U.S. Today, even under those Alice in Wonderland interpretations of what it means to be gainfully employed, there are only 88.4 percent of men aged 25 to 54 employed. There has been no meaningful improvement in that percentage in the last five years.
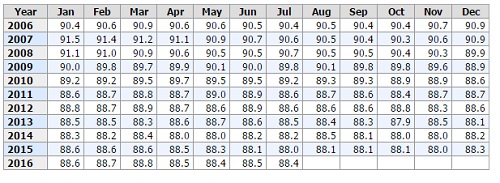
Labor Force Participation Rate in U.S. for Men Aged 25 to 54 in Percentages (Source: Bureau of Labor Statistics)
