
 By Pam Martens and Russ Martens: December 2, 2015
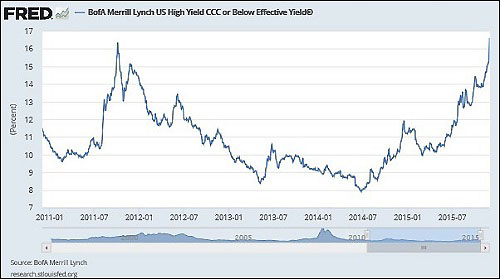
There are three major red flags waving in the wind over the U.S. junk bond market. First, the market is now approximately $1.8 trillion, about double the amount of junk bonds outstanding at the height of the financial crisis in 2008. Also, yields have skyrocketed, showing a growing aversion to risk by investors. As the above chart indicates, the lowest rated junk bonds (also called “high yield”) which have a CCC or lower rating, have seen their yields double from 8 percent to 16 percent since July of last year. And, finally, downgrades to ratings are swamping the number of upgrades, a telling sign of an overall deteriorating market. According to the ratings agency, Moody’s, the ratio of upgrades to downgrades is at the worst level since the financial crash in 2008-2009.
What have junk bond investors gotten in return for taking on all of this high risk this year? They’ve gotten a negative return of 2.20 percent – also the worst since the 2008 crisis.
Declining bond credit quality is no longer just centered in oil and shale companies that are bearing the brunt of collapsed oil prices. Lower rated credits issued by U.S. retail, media and pharmaceutical companies are also now experiencing declining bond prices and rising yields (bond prices move inversely to yield). According to Standard and Poor’s, on a global basis, companies have defaulted on $95 billion worth of debt this year, making it the largest year of defaults since the height of the credit crisis in 2009.
Equally problematic, a large part of the junk bond issuance did not go toward strengthening corporate balance sheets to help companies weather the next crisis. As financial blogger Wolf Richter reported on November 16:
“Not that these junk bonds have been issued over the past few years to fund productive activities that would generate cash flows with which to service the bonds. Far from it. According to LCD [Leveraged Commentary and Data] in 2015 so far, the proceeds from 46% of the newly issued junk bonds were used to refinance maturing bonds, paying early investors with money raised from new investors.
“Another 30% of junk bond issuance was used for M&A [mergers and acquisitions]. Valeant is a prime example. It’s teetering under $38 billion in debt and has a tangible net worth of a negative $33 billion. If it craters, the bloodletting among creditors will be brutal.
“And 16% of the junk bond issuance was used for ‘corporate purposes’ and ‘other,’ such as share buybacks, special dividends back to their private equity owners, and even some investments in productive activities, while 4% was used for LBOs [leveraged buyouts].
Wall Street bank regulators are starting to take notice of the deteriorating credit quality. On November 2, Thomas Curry, head of the Office of the Comptroller of the Currency (OCC) which regulates all national banks in the U.S., delivered a speech at the Risk Management Association’s annual conference in Boston. Curry stunned the audience with this:
“Just over the last two years, the key ratio of the loan loss allowance to total loans dipped by more than 40 percent. Although banks have argued, with some justice – and please note the qualification – that improvements in loan quality justified those reserve releases, drawdowns of that magnitude are clearly disproportionate…”
On October 21, Curry also told an audience at an Exchequer Club luncheon in Washington, D.C. that “we are clearly reaching the point in the cycle where credit risk is moving to the forefront.”
There is no question that credit risk is moving to the forefront in the U.S. and there is also no question that this credit risk is concentrated exactly where it was when it all hit the fan in 2008 – at the same mega Wall Street banks.
On November 25, units of Standard and Poor’s released a study showing that 30 global systemically important banks (G-SIBs) have $59.759 trillion in risk exposures with 20 of those banks accounting for 83 percent of the total. The United States has more G-SIBs than any other country, a total of 8, including Citigroup, which blew itself up in 2008, was resuscitated back to life with the largest taxpayer bailout in U.S. history, and now appears on the Office of Financial Research’s radar as one of the two most interconnected banks in the U.S.
Despite all of this, President Obama tells us we’ve made progress under the Dodd-Frank financial reform legislation and the leading Democratic Presidential candidate, Hillary Clinton, says she doesn’t believe we need to reinstate the Glass-Steagall Act to wall off insured savings deposits from the Wall Street casino. Fortunately for all of us, her two Democratic opponents, Vermont Senator Bernie Sanders and former Maryland Governor Martin O’Malley, are stridently disagreeing with Clinton on this point.
