By Pam Martens and Russ Martens: April 11, 2023
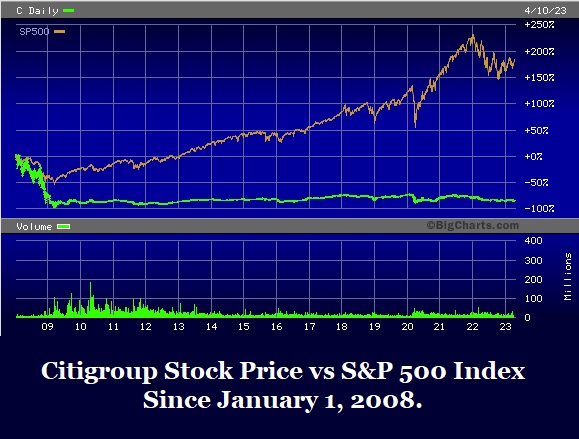
To read the headlines in the major business press, one would think that since the upheaval began in the U.S. banking system, the largest U.S. commercial banks have been the beneficiaries in terms of deposit inflows. For example, on March 13 the Financial Times ran this headline: “Large US banks inundated with new depositors as smaller lenders face turmoil.” The subhead was even more questionable, reading: “Failure of Silicon Valley Bank prompts flight to likes of JPMorgan and Citi.” (JPMorgan Chase has been charged with five felony counts by the U.S. Department of Justice over the past nine years while Citigroup’s stock has been a basket case since the financial collapse in 2008. Citi did a 1-for-10 reverse stock split in 2011 to window dress its stock price.) See Citigroup stock price chart below.
On March 25, CNBC ran a similar article about deposit inflows to the big banks. Its first paragraph read as follows:
“The surge of deposits moving from smaller banks to big institutions including JPMorgan Chase and Wells Fargo amid fears over the stability of regional lenders has slowed to a trickle in recent days, CNBC has learned.”
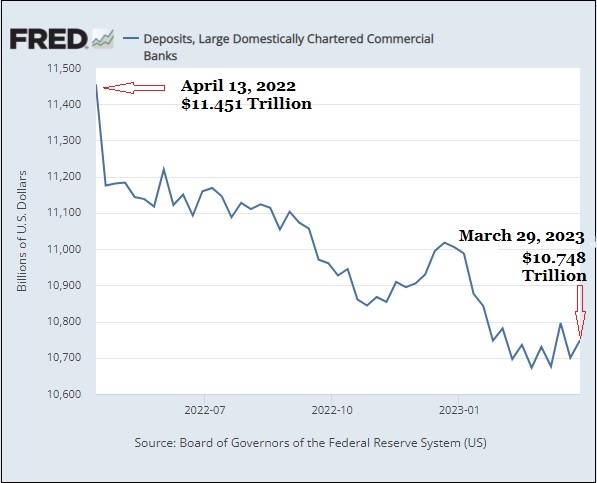
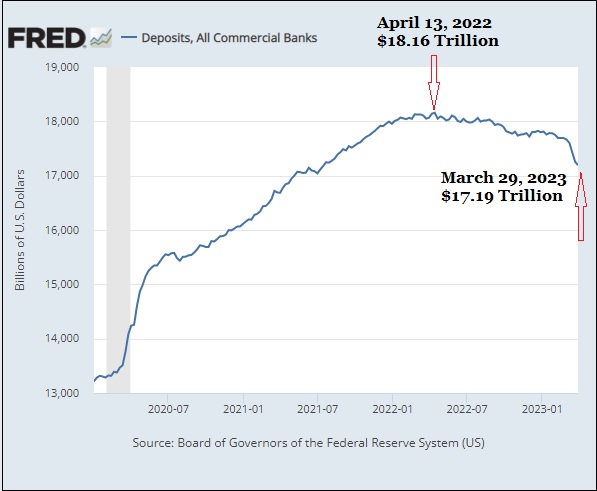
The reality is that the 25 largest domestically-chartered commercial banks in the U.S. have been bleeding deposits for most of the past 12 months, shedding more than $700 billion in deposits between April 13, 2022 and March 29, 2023. To put that in even sharper focus, all U.S. domestically-chartered commercial banks have lost a total of $970 billion during the same time period. That means that the largest 25 banks account for a whopping 72 percent of the plunge in deposits over the past year. (See chart below.)
Each Friday, at approximately 4:15 p.m., the Federal Reserve (the Fed) releases its H.8 report showing the assets and liabilities of commercial banks in the United States. That data includes deposits. The Fed’s H.8 data for all of these weekly releases going back to 1996 is available here. Equally helpful, the folks at the St. Louis Fed make it possible to chart much of that data via its FRED charting tools. (See, for example, the charts above.) We mention this because every American may need to become an expert on the U.S. banking system in order to separate fact from fiction and have confidence in where they are placing their bank deposits.
You may be thinking, should we really have confidence in numbers coming out of the Fed, which has so frequently been compromised by the mega banks on Wall Street. To be certain of the accuracy of our information, we cross-checked the deposit information with data at the Federal Deposit Insurance Corporation (FDIC).
Indeed, there was a blip in inflows of deposits to the largest U.S. commercial banks between March 8, 2023 and March 15, 2023. During that week, deposits to the 25 largest U.S. commercial banks increased from $10.67 trillion to $10.74 trillion or approximately $70 billion. But that small blip in inflows was quickly reversed. (See chart at the top of the page.)
What’s happening with the mega banks on Wall Street – all of which own trading casinos as well as federally-insured banks – will come under close scrutiny beginning this Friday. JPMorgan Chase, Citigroup and Wells Fargo are scheduled to report their earnings for the first quarter on Friday, April 14. Bank of America is scheduled to report earnings for the same period next Tuesday, April 18. Goldman Sachs will also report earnings on Tuesday, April 18. (Given Goldman’s struggles in the last quarter of 2022, its earnings for the first quarter of this year are certain to be closely scrutinized.) Goldman’s peer bank, Morgan Stanley, will report on Wednesday, April 19.