
By Pam Martens and Russ Martens: November 4, 2022 ~

Josh Bivens, Director of Research, Economic Policy Institute
On April 21 Josh Bivens posted a titillating analysis on the Working Economics Blog. Bivens has a Ph.D. in Economics from the New School for Social Research and is the Director of Research at the Economic Policy Institute. The blog post was titled: “Corporate profits have contributed disproportionately to inflation. How should policymakers respond?”
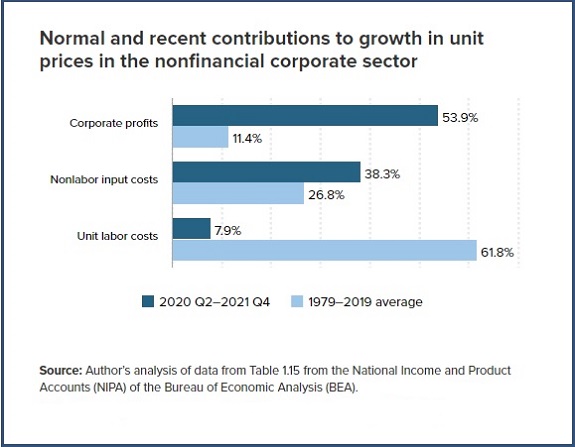
Included in the blog post was a graph showing that corporate profits account for 53.9 percent of the recent rise in inflation versus an average of 11.4 percent for the period 1979 through 2019. (See above chart.)
Bevins’ chart made it into the hands of Congresswoman Katie Porter, who blew it up into a giant poster and explained its significance during a hearing before the House Subcommittee on Economic and Consumer Policy on September 22. The hearing was titled: “Power and Profiteering: How Certain Industries Hiked Prices, Fleeced Consumers, and Drove Inflation.” Armed with the chart, Porter said this during the hearing: “This is another really important point when we talk about inflation – what consumers are experiencing. Prices are not going up just because of supply chain or labor or some other invisible market forces, they are going up because powerful executives are making deliberate choices to maximize their profits at the expense of the rest of us.”
The video clip of Porter went viral on Youtube; was picked up by the Jon Stewart podcast; featured on The View; and this week Katie Porter appeared in person on the MSNBC news program, All In with Chris Hayes, to discuss the chart further. (See video clip below.) The hearing witness that Porter is questioning in the video about the graph is Mike Konczal, the Director of Macroeconomic Analysis at the Roosevelt Institute. Konczal confirms that the data on the graph is accurate and provides his Institute’s own research on how corporations are using their market power to increase markups.
In his blog post, Bivens explores the rise in corporate power in an effort to understand how corporations are getting away with these unprecedented price increases. He writes:
“It is unlikely that either the extent of corporate greed or even the power of corporations generally has increased during the past two years. Instead, the already-excessive power of corporations has been channeled into raising prices rather than the more traditional form it has taken in recent decades: suppressing wages. That said, one effective way to prevent corporate power from being channeled into higher prices in the coming year would be a temporary excess profits tax.”
In a similar vein, Katie Porter said this on the Chris Hayes’ program:
“The market power of these big corporations has grown. As small businesses, medium size businesses have been gobbled up by larger businesses, squeezed out by the pandemic, unable to deal with their supply chain issues, the largest corporations bankrolled by Wall Street have gotten more and more powerful. So what we find is that the biggest price gouging goes on in the very industries where there are the biggest players — things like Big Oil where we only have a handful of companies that dominate the market and control the supply.”
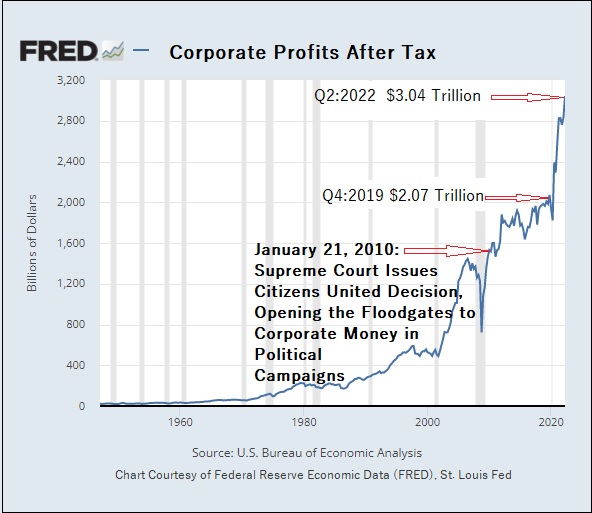
The St. Louis Fed has a monster amount of economic data available for the public to graph with a few clicks of a mouse under its FRED program (Federal Reserve Economic Data). We decided to graph after-tax corporate profits over decades to see how the more recent trend stacks up. We were absolutely stunned.
As the chart below indicates, corporate profits have gone ballistic since the Supreme Court issued its Citizens United decision in 2010, opening the floodgates for corporate money to finance the political campaigns of the members of Congress. If corporations believe they own a large swath of Congress, then they have nothing to fear from pandemic profiteering.
This tangled web of dark money and corporate PACs underpinning corporate power may now present a serious risk to the financial stability of the United States. The Fed’s inflation-fighting toolkit has yet to be evaluated in a post Citizens United world.
