
By Pam Martens and Russ Martens: June 8, 2022 ~
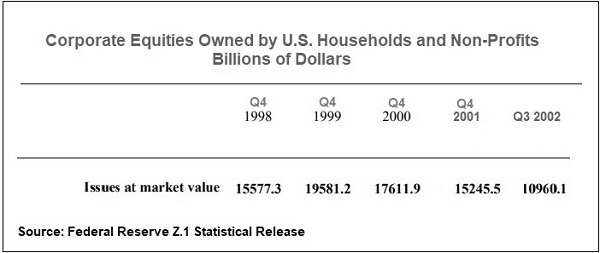
According to the Federal Reserve’s Z.1 Statistical Releases, as of December 31, 1996 the market value of stocks (“corporate equities”) held by U.S. households and U.S. nonprofits stood at $10.255 trillion. As the dot.com bubble mushroomed, by December 31, 1999 that figure stood at $19.58 trillion.
By the time all of the fraudulent research that went into listing and promoting stocks came to light, household and nonprofit wealth had shrunk by $8.6 trillion. From the end of Q4 1999 to the end of Q3 2002, the market value of household and nonprofit holdings went from $19.5812 trillion to $10.9601trillion. (See chart below.)
Wall Street makes big bucks from underwriting new issues of stocks (Initial Public Offerings or IPOs) and so do the Big Law firms that serve as the underwriters’ counsel. It doesn’t matter if these companies have zero business operations (as in the case of today’s SPACs), have dodgy accounting practices (as in the case of many of today’s Chinese companies listed on U.S. exchanges), or are alleged to be an outright “fraud” and a “scam” in a detailed 188-page report, as in the case of QuantumScape. These companies can still get listed on U.S. stock exchanges and continue to trade in U.S. stock markets – right under the nose of the Securities and Exchange Commission, the U.S. Department of Justice and all those high-paid Wall Street lawyers that supposedly conduct due diligence on these offerings.
For an in-depth look at the dirty underbelly of a listing on the NYSE American exchange, India Globalization Capital, you can read the outstanding reporting by Ciara Linnane, Francine McKenna, and Tomi Kilgore of MarketWatch.
To understand why so much garbage continues to get listed on U.S. exchanges, only to eventually blow up, consider these immortal words by the infamous Jack Grubman, the poster boy for pumping out glowing research reports on companies that were known to be dogs inside his Wall Street firm, Citigroup’s Salomon Smith Barney, during the dot.com era. In one internal email, Grubman wrote: “Most of our banking clients are going to zero and you know I wanted to downgrade them months ago but got huge pushback from banking.” (Grubman was eventually banned from the industry by the SEC but paid a fine that was just a small fraction of the millions of dollars he had collected in compensation.)
On April 28, 2003, the SEC settled the rigged research practices of the dot.com era with 10 Wall Street banks for $875 million. Investors had lost trillions of dollars but Wall Street got off with a payment of $875 million. No one went to jail.
Systemically corrupt practices on Wall Street in derivatives and subprime debt brought about the financial crash of 2008, the worst since the Great Depression, which was summed up by the Financial Crisis Inquiry Commission (FCIC) report as follows:
“The profound events of 2007 and 2008 were neither bumps in the road nor an accentuated dip in the financial and business cycles we have come to expect in a free market economic system. This was a fundamental disruption—a financial upheaval, if you will—that wreaked havoc in communities and neighborhoods across this country. As this report goes to print, there are more than 26 million Americans who are out of work, cannot find full-time work, or have given up looking for work. About four million families have lost their homes to foreclosure and another four and a half million have slipped into the foreclosure process or are seriously behind on their mortgage payments. Nearly $11 trillion in household wealth has vanished, with retirement accounts and life savings swept away. Businesses, large and small, have felt the sting of a deep recession. There is much anger about what has transpired, and justifiably so. Many people who abided by all the rules now find themselves out of work and uncertain about their future prospects. The collateral damage of this crisis has been real people and real communities. The impacts of this crisis are likely to be felt for a generation. And the nation faces no easy path to renewed economic strength.”
So $8.6 trillion was erased in the dot.com era; $11 trillion was erased after the 2008 financial crash. How much could the vaporization of wealth be this time around? The answer is that we have never seen a bubble of this magnitude before, pumped up with a combination of dodgy listings, Dark Pools, inflated valuations from stock buybacks, and 85 percent leverage on margin loans to hedge funds, to name just a few of the unchecked practices.
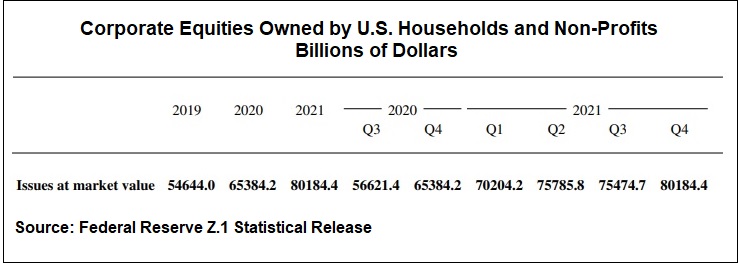
Consider the chart below compiled from the Federal Reserve’s Z.1 Statistical Releases. From the end of Q4 2019 to the end of Q4 2021, the market value of corporate equities held by U.S. households and nonprofits went from $54.64 trillion to $80.184 trillion. That’s an increase of $25.54 trillion. If even half of that increase was retraced in a bear market, we’re looking at a negative wealth effect of more than $12.5 trillion.
The next time you hear officials from the Fed talking about a soft landing, pull out these charts and give them a good look.
