Dow Jones Industrial Average Chart, Wednesday, May 4, 2022
By Pam Martens and Russ Martens: May 9, 2022 ~
Beginning in November of 2008, the Fed was allowed by Congress to manipulate the U.S. bond market through purchases of bonds with money it creates at the flick of an electronic button. The Fed calls this “Quantitative Easing” or QE.
Beginning on September 17, 2019 – when overnight lending rates on repo (repo means repurchase agreements between financial institutions) touched 10 percent instead of the 2-1/2 percent that the Fed wanted the market to be at – the Fed began providing repo loans at “administered rates.” It did that by jumping into the repo market with both feet, proceeding to make trillions of dollars in cumulative loans to trading houses on Wall Street, at interest rates as low as 0.10 percent by the spring of 2020.
During 2020, the Fed also artificially propped up money market mutual funds, commercial paper, Exchange Traded Funds (ETFs) and the corporate bond market with emergency lending facilities it created. The Fed did not need a vote in Congress to create those bailout programs. It needed only the permission of Steve Mnuchin, Donald Trump’s wily U.S. Treasury Secretary.
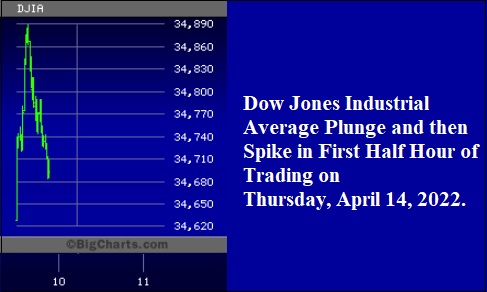
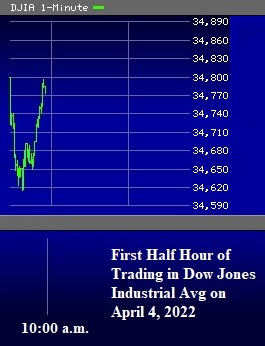
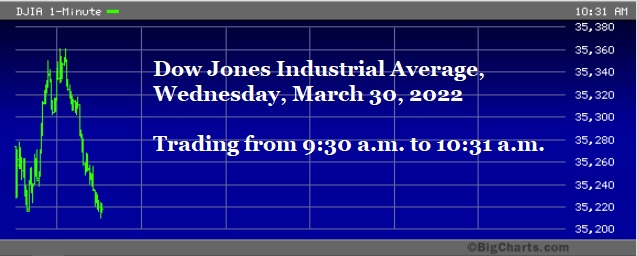
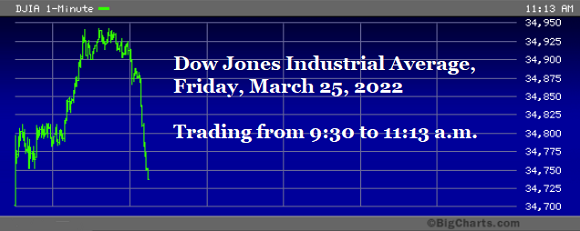
Wall Street On Parade has been witnessing a persistent new pattern in the stock market for several months now where the market plunges at the open and then shortly thereafter, on no major news, it turns on a dime and spikes higher. This suggests one of two things to us: (1) either the New York Fed is manipulating stock trading out of its second office close to the futures markets in Chicago; or (2) big money at Wall Street trading houses and/or hedge funds are doing it. Either way, the SEC and the Justice Department have not nipped this activity in the bud.
On January 31, Wall Street On Parade reported that the New York Fed, which is the only one of the 12 regional Federal Reserve banks to have a trading floor – complete with those expensive Bloomberg data terminals and speed dials to Wall Street’s biggest trading houses – had decided, after 100 years of operation, that it needed a second trading floor in Chicago where S&P 500 futures are traded along with other futures contracts. (Read our detailed report here with photos.)
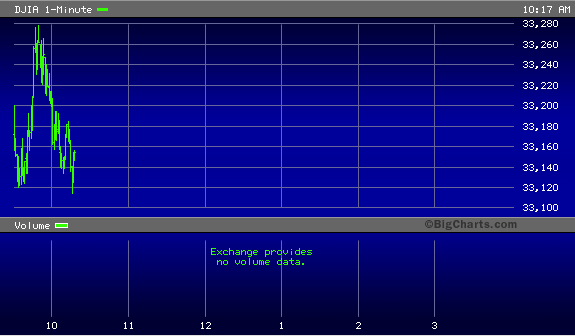
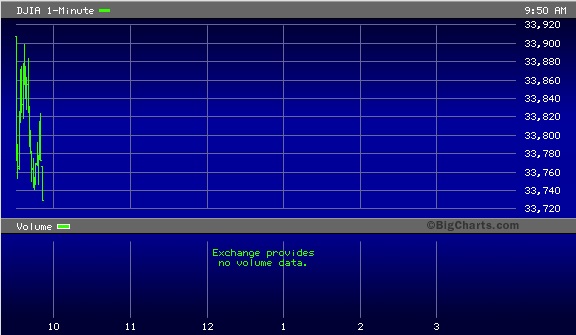
Take a look at some of these price moves that we have captured below in the Dow Jones Industrial Average since March. Nothing about this is normal. If this is allowed to continue and the SEC does not explain, with credible details, who is behind these moves, what’s left of confidence in U.S. markets is going to evaporate.
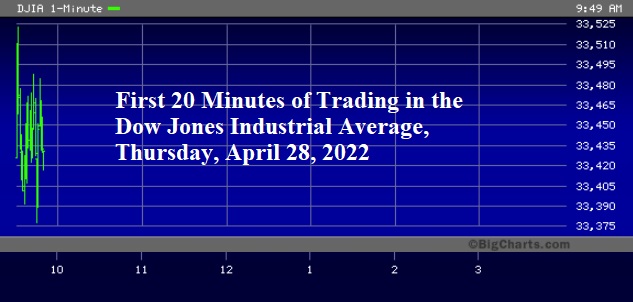

Dow Jones Industrial Average Chart, Wednesday, April 27, 2022
Dow Jones Industrial Average Chart, Tuesday, April 26, 2022