
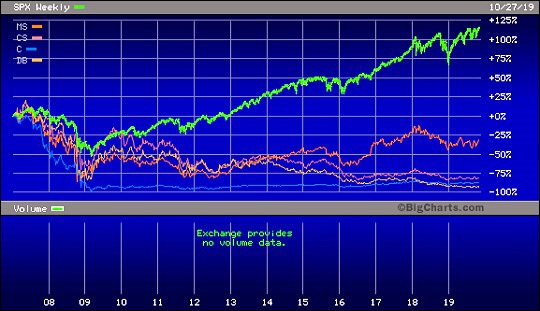
S&P 500 Versus Stock Prices of Morgan Stanley (MS), Credit Suisse (CS), Citigroup (C) and Deutsche Bank (DB) Since January 1, 2007
By Pam Martens and Russ Martens: November 1, 2019 ~
Fed Chairman Jerome Powell had a Greenspan moment on Wednesday during his press conference. He made several Goldilocks statements about the banks that are going to come back to haunt him just as former Fed Chairman Alan Greenspan’s Alice in Wonderland remarks to Congress in the leadup to the greatest financial crash since the Great Depression have now made him appear to have been either lying to Congress or dangerously out of touch. It took just a few moments for us to pull up some charts to disprove the statements made by Powell.
Powell stated the following during the Q&A portion of the press conference:
“So, we monitor financial stability risks very carefully all of the time. It’s what we do since the financial crisis, as I’ve mentioned before. Currently, we don’t see large imbalances. This long expansion is notable for the lack of large financial imbalances like the ones we’ve seen certainly before the crisis happened.”
If the Fed and Jerome Powell aren’t seeing large imbalances, it’s simply because they aren’t looking or they are consciously choosing to stick their heads in the sand.
Above is a chart showing what has happened to the share prices of four global banks versus the Standard and Poor’s 500 since January 1, 2007. Despite more than a decade of economic recovery, these banks have lost serious ground in terms of rebuilding common equity – the buffer that would help get them through another downturn or crash. That’s a big imbalance considering that three of the banks in the graph above, Citigroup, Deutsche Bank and Morgan Stanley, are huge players in the high-risk derivatives market in the U.S.
According to the Office of the Comptroller of the Currency (OCC), the federal regulator of national banks in the U.S. that publishes a quarterly report on the derivative holdings of each of the mega banks in the U.S., derivative risks have grown exponentially since the financial crash of 2008. At the very height of the market panic on September 30, 2008, U.S. bank holding companies held $185 trillion in notional (face amount) of derivatives. As of June 30, 2019, that figure stands at $280 trillion – an increase of 51 percent.
And here’s another imbalance: that derivative risk is concentrated among just five mega bank holding companies who are responsible for 86 percent of all derivatives at the more than 5,000 U.S. banks and savings associations. Those five bank holding companies are: JPMorgan Chase, Citigroup, Goldman Sachs, Bank of America and Morgan Stanley. We’d call that a very big imbalance.
The OCC also notes that Goldman Sachs’ total credit exposure to capital stood at 372 percent; Citigroup’s Citibank stood at 132 percent and JPMorgan Chase’s stood at 150 percent. JPMorgan Chase and Citigroup own two of the largest commercial banks in the U.S. that hold federally-insured deposits backed by the U.S. taxpayer, while the banks are also speculating in high risk derivatives. We’d call that a big imbalance and a serious threat to financial stability.
The role of derivatives in the financial crash of 2008 was clearly spelled out by the official report from the Financial Crisis Inquiry Commission. It stated:
“the existence of millions of derivatives contracts of all types between systemically important financial institutions—unseen and unknown in this unregulated market—added to uncertainty and escalated panic, helping to precipitate government assistance to those institutions.”
The Federal Reserve is actually adding to the derivatives problem by failing to redesign its stress tests of the mega banks, even after a research study was released by another federal agency pointing out that the Fed’s stress test is deeply flawed.
In 2016, researchers at the Office of Financial Research looked at how the Fed was conducting its stress tests. The researchers, Jill Cetina, Mark Paddrik, and Sriram Rajan, concluded that the stress tests were gauging counterparty risk on a bank by bank basis. The real problem was the contagion that would spread rapidly if one big bank’s counterparty was also a key counterparty to other systemically important Wall Street banks. The researchers wrote:
“A BHC [bank holding company] may be able to manage the failure of its largest counterparty when other BHCs do not concurrently realize losses from the same counterparty’s failure. However, when a shared counterparty fails, banks may experience additional stress. The financial system is much more concentrated to (and firms’ risk management is less prepared for) the failure of the system’s largest counterparty. Thus, the impact of a material counterparty’s failure could affect the core banking system in a manner that CCAR [one of the Fed’s stress tests] may not fully capture.” [Italic emphasis added.]
Deutsche Bank and Citigroup, two of the global banks whose share prices suggest trouble, are large derivative counterparties to other global banks.
This is a stability risk that the Fed is clearly refusing to acknowledge because it lacks the guts to take on the massive Wall Street lobbying machine. Apparently, the Fed would rather allow the system to implode on itself again than confront an uncomfortable truth.
On the subject of leverage and bubbles, Powell said this during the press conference:
“The first is leverage in the financial system which is low by historical standards. The second is funding risk which is the risk of runnable funding, and that risk is also quite low for banks but also for, you know, the nonbanking financial sector. If you look at asset prices, we see some high asset prices, but not broadly across a range. We don’t see bubbles in that kind of thing.”
We just had one of the craziest proposed IPOs in the history of Wall Street, WeWork. The IPO was slated to be underwritten by two of the so-called sophisticated banks on Wall Street – JPMorgan Chase and Goldman Sachs – and it was so close to going public that it had filed its prospectus with the Securities and Exchange Commission. Its proposed valuation was $47 billion which turns out to have been inflated by 83 percent from its true valuation. Fortunately for the American people, that IPO failed — not because federal regulators saw through the charade but because the financial press did its job.
Or consider the bubble we described in March of last year. We found that five U.S. traded stocks, in a period of less than three years, had grown from $1.889 trillion to $3.409 trillion. Those stocks were Apple, Google’s parent Alphabet, Microsoft, Facebook and Amazon.
At the time of our report, the $3.409 trillion market cap of those five companies was more than 10 percent of the total market capitalization of all 3,000 stocks in the Russell 3000. The value of those five stocks today is $4.5 trillion. If that’s not a dangerous imbalance, we don’t know what is.
