
By Pam Martens and Russ Martens: October 3, 2019 ~

New York Stock Exchange Trading Floor
The Dow Jones Industrial Average has lost 838 points in the past two days of trading. On a percentage basis, its losses pale in comparison to the losses experienced over the past two days by some of the biggest global banks as well as insurance companies that are derivative counterparties to the big banks.
Mega banks continue to be allowed to tie their risky trading gambles to the balance sheets of insurers that also hold life insurance policies and retirement annuities for Moms and Pops across the U.S. by using the insurers as counterparties for their derivative trades. That this is still happening illustrates just how little has changed in the way of enlightened regulation of Wall Street since the banks brought down the big insurer, AIG, in 2008. The U.S. government was forced to seize AIG and institute a $185 billion bailout. AIG also held life insurance policies and retirement annuities for Moms and Pops across the country while it was simultaneously backing tens of billions of dollars of credit derivatives for Wall Street banks, which it couldn’t make good on.
The AIG bailout money went in the front door and then out the back door to Wall Street banks, foreign banks and hedge funds who were the recipients of over half ($93.2 billion) of AIG’s bailout money. AIG was eventually forced to release a chart of these payments – although it is still not clear if these disbursements cover the full scale of what was paid to AIG’s derivative counterparties since the chart covers a limited timeframe.
We know which insurance companies are making risky derivative gambles with the mega banks because the 2017 Financial Stability Report from the Office of Financial Research (OFR), the Federal agency created under the 2010 Dodd-Frank reform legislation, named them. Those U.S. insurers are: Ameriprise Financial, Hartford Financial Services Group, Lincoln National Corp., Prudential Financial, Voya Financial, MetLife and – as a commentary on the failure of Dodd-Frank – AIG is still in the game.
Over the past two trading days this is how those seven insurers have fared: Lincoln National Corp. has lost a whopping 8.4 percent; Ameriprise Financial has given up 8.24 percent; MetLife fell 6.5 percent; Voya Financial has lost 6.3 percent; Prudential Financial was down 6 percent; while Hartford Financial Services Group and AIG fell a more modest 4 percent.
The 2017 OFR report had this to say about the derivative interconnections of mega banks with the insurers:
“…some of the largest insurance companies have extensive financial connections to U.S. G-SIBs [Global Systemically Important Banks] through derivatives. For some insurers, evaluating these connections using public filings is difficult. Insurance holding companies report their total derivatives contracts in consolidated Generally Accepted Accounting Principles (GAAP) filings. Insurers are required to report more extensive details on the derivatives contracts of their insurance company subsidiaries in statutory filings, including data on individual counterparties and derivative contract type. But derivatives can also be held in other affiliates not subject to these statutory disclosures, resulting in substantially less information about some affiliates’ derivatives than required in insurers’ statutory filings.”
MetLife is a particularly problematic situation for regulators. It went to Federal district court and won a ruling to block the government from labeling it a SIFI (Systemically Important Financial Institution) during the Obama administration, which would have subjected it to more oversight and regulation. (The Trump administration dropped the appeal in the case in 2018.) But MetLife continues to trade like it has a systemic problem when there are clouds on the financial horizon. In two trading days in June 2016, following the Brexit vote in the U.K., MetLife lost 17.3 percent of its market value or $8.4 billion.
This is what the Financial Stability Oversight Council (F-SOC) had to say about MetLife when it made its initial determination to label it a SIFI:
“MetLife leads the U.S. life insurance industry in certain institutional products and capital markets activities, such as issuances of funding agreement-backed notes (FABNs), guaranteed minimum return products (such as general and separate account GICs), and securities lending activities. These activities expose other market participants to MetLife and create on– and off– balance sheet liabilities that increase the potential for asset liquidations by MetLife in the event of its material financial distress. Efforts to hedge such risks through derivatives and other financial activities are imperfect and further increase MetLife’s complexity and interconnectedness with other financial markets participants…”
The report also determined that MetLife was regularly drinking from the bailout trough during the 2008-2009 financial crisis:
“During 2008 and 2009, MetLife’s subsidiary bank accessed the Federal Reserve Term Auction Facility 19 times for a total of $17.6 billion in 28- day loans and $1.3 billion in 84-day loans. In March 2009, MetLife raised $397 million through the Temporary Liquidity Guarantee Program run by the Federal Deposit Insurance Corporation (FDIC), which enabled the organization to borrow funds at a lower rate than it otherwise would have been able to obtain. Additionally, MetLife borrowed $1.6 billion through the Federal Reserve’s Commercial Paper Funding Facility.”
F-SOC wrote further that “material financial distress at MetLife could pose a threat to U.S. financial stability” and warned that “Large financial intermediaries, including global systemically important banks (G-SIBs) and global systemically important insurers (G-SIIs), have significant exposures and interconnections to MetLife through its institutional products and capital markets activities.”
We thought it might be instructive to see what a trading chart looked like over the past two days showing how MetLife compared to several global banks (Bank of America, Goldman Sachs and Morgan Stanley) that also did poorly in that span of time. The deeply correlated chart below should give regulators, Congress and every American taxpayer pause.
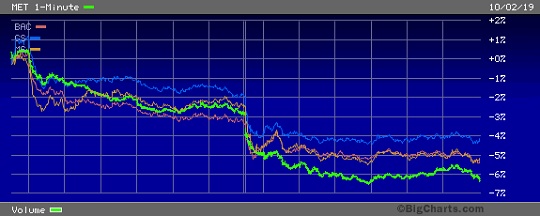
Trading Charts of MetLife (Green) versus Bank of America (Red), Goldman Sachs (Blue) and Morgan Stanley (Orange) Over Two Trading Days, October 1st and 2nd, 2019
