
By Pam Martens and Russ Martens: July 25, 2019 ~
![]() If you are buying stocks based on what your stockbroker (a/k/a “financial advisor”) is telling you the research analysts at his brokerage firm are recommending, our headline above should provide a cautionary warning.
If you are buying stocks based on what your stockbroker (a/k/a “financial advisor”) is telling you the research analysts at his brokerage firm are recommending, our headline above should provide a cautionary warning.
On July 21, Philip Van Doorn, a reporter for Dow Jones’ MarketWatch, published a chart showing that 82 percent of bank research analysts on Wall Street have a “buy” rating on the stock of Citigroup. According to MarketBeat.com, among the stock analysts making “buy,” “outperform,” or “overweight,” recommendations on Citigroup are those receiving a paycheck from Goldman Sachs, Credit Suisse, Morgan Stanley, JPMorgan, Deutsche Bank, UBS, and Bank of America – all of whom have a vested interest in wanting Citigroup – and each other — to stay strong because they are all interconnected as derivative counterparties.
All of these banks are in a unique position to help Citigroup reach the elevated price targets set by their research analysts because the Securities and Exchange Commission (SEC) continues to allow Wall Street’s mega banks to trade each other’s stock, as well as the stock of their own bank, in their own Dark Pools. Dark Pools are, effectively, unregulated stock exchanges operating inside the bowels of the largest Wall Street banks.
For example, while its stock analyst is encouraging the public to buy the shares of Citigroup, during the week of July 1, 2019 (the most recent week that Dark Pool data is available, which was a light-trading, holiday shortened week that contained the 4th of July when markets were closed) Goldman Sach’s Dark Pool in the U.S. called Sigma X2 traded 194,567 shares of Citigroup in 1,585 separate trades. But Goldman Sachs owns Dark Pools that trade on three other continents under separate regulatory regimes, so the U.S. public actually has no idea how many shares of Citigroup are being traded in Goldman’s Dark Pools, or, for that matter, how many shares of its own stock it’s trading each week. (See Wall Street Banks Are Trading in Their Own Company’s Stock: How Is This Legal?)
Morgan Stanley is, insanely, allowed to operate three separate Dark Pools called MS Trajectory Cross ATS-1; MS Pool ATS-4; and MS RPool ATS-6. Those three pools traded a total of 584,400 shares of Citigroup in 3,109 separate trades during the same week. Since Dark Pool trading is dark and reporting of trades is delayed, how can the public have any confidence that Morgan Stanley’s Dark Pools aren’t making a two-sided market in Citigroup’s shares while its bank analyst is touting the stock to the public?
Why should any Wall Street bank be allowed to make research recommendations on stocks and then trade in those very same stocks in a Dark Pool it owns, let alone three Dark Pools all under the same ownership?
For the same July 1 week, Credit Suisse’s Dark Pool, Crossfinder, traded 399,828 shares of Citigroup in 2,891 separate trades. JPMorgan’s Dark Pool, JPM-X, traded 202,904 shares of Citigroup stock in 1,085 separate trades while Deutsche Bank’s Dark Pool, SuperX, traded 129,300 shares in a meager 812 separate trades. Merrill Lynch, part of Bank of America, owns a Dark Pool called Instinct X, it traded 116,647 shares of Citigroup in 689 separate trades.
The Dark Pool owned by UBS, UBS ATS, was the largest Dark Pool trader in the shares of Citigroup for the week of July 1. It traded close to one million shares (963,468) in a total of 8,493 separate trades.
Altogether, these and other Dark Pools traded 3,836,757 shares of Citigroup’s stock in the July 1 week away from the public stock exchanges in the dark belly of Wall Street. That constituted 25,404 separate trades that the public knows next to nothing about including what day they occurred or what time of day they occurred.
Making this overwhelming bullishness on Citigroup all the more suspicious is the fact that Citigroup’s stock chart should make everyone’s hair stand up on the back of their neck. The stock price is still down 87 percent from where it traded in 2007 before it imploded in the Wall Street crash of 2008 and received the largest taxpayer bailout and Federal Reserve bailout in global banking history.
The company has done plenty to try to hide this fact from investors, including doing a 10-for-1 reverse stock split on May 9, 2011, leaving shareholders with 1 share for each 10 shares previously held. That did nothing to boost the fortunes of its shareholders, it just made the share price look ten times better to uninformed investors.
You should think seriously about all of this the next time your broker calls with a hot buy recommendation on any Wall Street bank stock.
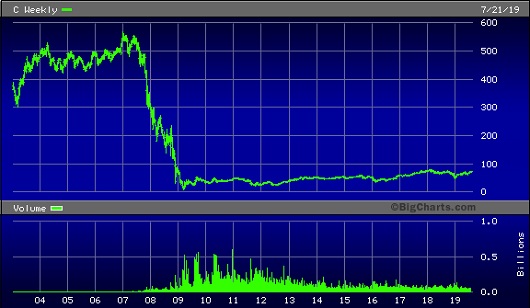
Citigroup Stock Chart, January 1, 2003 to July 21, 2019
