
Source: Office of Financial Research (OFR)
By Pam Martens and Russ Martens: May 3, 2019 ~
During the question and answer period of Federal Reserve Chairman Jerome Powell’s press conference on Wednesday, Michael McKee of Bloomberg News asked the Chairman the following question:
“I’m curious about the financial conditions that you see out there. The minutes of the March meeting tell us a few officials worried about financial stability risks. Was there a broader discussion at this meeting? Any consensus on whether such risks are growing as the markets hit new highs and we do see some instability in short-end trading. Is it possible that rates are too low at this point?”
Jerome Powell, Federal Reserve Chairman
Powell answered the first part of the question as follows:
“…I’d say that the headline really is that while there are some concerns around nonfinancial corporate debt, really the finding is that overall financial stability vulnerabilities are moderate on balance and, in addition, I would say that the financial system is quite resilient to shocks of various kinds with high capital liquidity…”
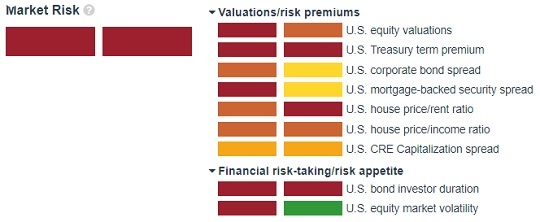
The curious thing about that answer is that there are, literally, charts flashing red at the Office of Financial Research (OFR), the Federal agency created under the Dodd-Frank financial reform legislation to keep the Fed and other Federal regulators informed of any growing financial stability risks.
The OFR’s Financial System Vulnerabilities Monitor uses a color-coded system to warn of risks, with green being low vulnerability, yellow and orange being moderate and red signaling high risk. Above is OFR’s current chart on Market Risks. That looks like an awful lot of things in the red zone. The full Monitor (be sure to click on the “show all” button) has plenty of things in the green zone but we wouldn’t get too comfortable about just how much clarity the OFR has on some key issues. For example, under Financial Institution Leverage, OFR shows both median and aggregate U.S. commercial bank leverage in the cozy green zone. That’s far from the full picture, however.
Compare that green zone to what another Federal bank regulator, the Office of the Comptroller of the Currency (OCC), which has oversight of national banks, shows in its derivatives data. (See Table 4 in the Appendix here.) That table shows that Goldman Sachs Bank USA, a taxpayer backstopped bank that is Federally-insured by the Federal Deposit Insurance Corporation (FDIC), has 354 percent total credit exposure to capital. The bank has $32.5 billion in risk-based capital versus $40.3 trillion in notional (face amount) in derivatives. JPMorgan Chase and Citigroup’s Citibank show 167 percent and 132 percent, respectively, in the same category.
If you recall from the last financial crisis, all it takes is one or two heavily interconnected Wall Street banks to freeze up the whole system as banks stop lending to one another over fears about who has exposure to the teetering mega banks and their doomsday derivative machine.
Which leads us to another red zone chart at the OFR’s heat map. It’s called U.S. Bank cross-border claims/total assets. According to the detailed breakdown at the OFR, this means the cross-border claims measured on immediate counterparty basis, divided by total assets to banks and bank holding companies reporting cross-border claims.
Sometimes a picture is worth a thousand words. To get your head around this problem, consider the graph below of just Goldman Sachs’credit derivative exposures during the financial crisis in 2008 (not its full derivative exposures). Its largest exposure was to a foreign bank – the German Deutsche Bank, whose stock last year lost 58 percent of its value. As of yesterday’s close at $8.22, Deutsche Bank is trading just 60 cents above its all time low. (Deutsche Bank was a $120 stock in 2007.)
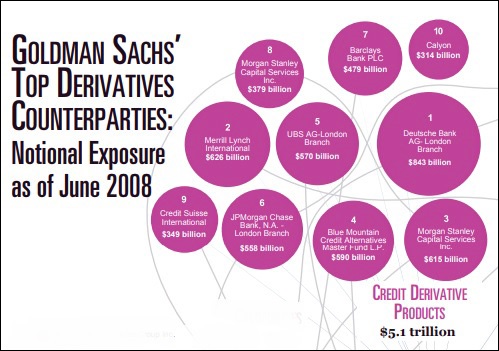
Source: Financial Crisis Inquiry Commission
Goldman also had significant cross-border exposure in 2008 to Barclays of the U.K. and Switzerland’s Credit Suisse. And the red zone problem today is not just counterparty risk or cross border risk – it’s also contagion risk because every other major Wall Street bank is effectively using the same global banks and insurance company counterparties for their derivative trades.
Phil Angelides, the Chair of the Financial Crisis Inquiry Commission, which had a congressional mandate to investigate the 2008 collapse on Wall Street, made these remarks at a hearing convened to examine “The Role of Derivatives in the Financial Crisis.”
“I must say that despite 30 years in housing, finance, and investment — in both the public and private sectors — I had little appreciation of the tremendous leverage, risk, and speculation that was growing in the dark world of derivatives. Neither, apparently, did the captains of finance nor our leaders in Washington.
“The sheer size of the derivatives market is as stunning as its growth. The notional value of over the-counter derivatives grew from $88 trillion in 1999 to $684 trillion in 2008. That’s more than ten times the size of the Gross Domestic Product of all nations. Credit derivatives grew from less than a trillion dollars at the beginning of this decade to a peak of $58 trillion in 2007. These derivatives multiplied throughout our financial markets, unseen and unregulated. As I’ve explored this world, I feel like I have walked into a bank, opened a door, and seen a casino as big as New York, New York. Unlike Claude Rains in Casablanca we should be ‘shocked, shocked’ that gambling is going on.
“As the financial crisis came to a head in the fall of 2008, no one knew what kind of derivative related liabilities the other guys had. Our free markets work when participants have good information. When clarity mattered most, Wall Street and Washington were flying blind…
“In June 2008, Goldman’s derivative book had a stunning notional value of $53 trillion.”
It’s a decade later now and the American people have suffered enormous pain and financial losses because of the greed, corruption and unsupervised recklessness on Wall Street. Have Congress and Federal banking regulators learned anything?
According to the most recent OCC data for the quarter ending December 31, 2018, Goldman Sachs’ still has $42.3 trillion notional in derivatives at its bank holding company – a negligible reduction of 20 percent from the crisis era. In June of 2008, Citigroup’s bank holding company had $40 trillion notional in derivatives according to the OCC. As of December 31, 2018, OCC’s latest data, Citigroup’s bank holding company has $46.8 trillion in derivatives – an actual increase over the crisis era, despite the fact that derivatives were a major factor in the bank blowing itself up and Citigroup receiving the largest government bailout in global banking history. This is regulatory hubris at its finest.
The OFR indicates on its website that the Federal Reserve has its own heat map showing where financial vulnerabilities are rising. But OFR notes this about the secretive Fed: “The Federal Reserve updates its heat map internally on a regular basis but the ongoing results are not available to the public.” OFR also indicates that the Fed’s heat map does not include contagion risk.
By not including contagion risk the Fed is effectively asking to remain the puppet of Wall Street’s mega banks as well as remain ignorant of where the real red zones are in the U.S. financial system. There seems to be a clear pattern of this at the Fed. (See These Charts Show the Fed’s Stress Tests as a Dangerous Illusion and Treasury Drops a Bombshell: Fed’s Stress Tests Get It Wrong.)
