
Source: 2013 Infrastructure Report Card from the American Society of Civil Engineers
By Pam Martens and Russ Martens: January 27, 2017
During his first week in office, Donald Trump issued an executive order stating that it “is the policy of the executive branch” to “secure the southern border of the United States through the immediate construction of a physical wall on the southern border” with Mexico. Researchers have put the cost of the wall at $15 to $25 billion. That price tag would come to a nation with a staggering national debt of $19.9 trillion and a D+ rating on its critical infrastructure that plays an essential role in the country’s economic growth and ability to pay its debt.
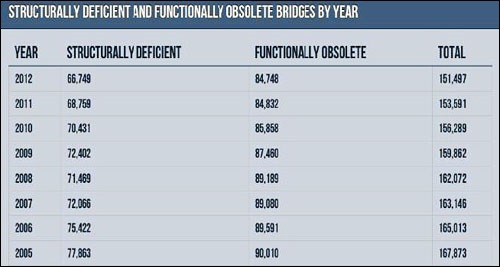
Every four years the American Society of Civil Engineers (ASCE) releases a comprehensive assessment of the U.S. infrastructure. The last report was released in 2013 giving a D+ rating to U.S. infrastructure. (The next report is due in March of this year.) The 2013 report found that drivers in the U.S. are making two hundred million trips daily across deficient bridges in the nation’s 102 largest metropolitan regions. The worst region for structurally deficient and/or functionally obsolete bridges is where the President of the United States tools around. According to ASCE’s 2013 report card, “the nation’s capitol tops all 50 states, with 77 percent or 185 of 239 bridges in the District of Columbia falling into at least one of these categories.”
Since 2000, there have been multiple bridge collapses across the U.S. This is how the National Transportation Safety Board describes the worst of these:
“About 6:05 p.m. central daylight time on Wednesday, August 1, 2007, the eight-lane, 1,907-foot-long I-35W highway bridge over the Mississippi River in Minneapolis, Minnesota, experienced a catastrophic failure in the main span of the deck truss. As a result, 1,000 feet of the deck truss collapsed, with about 456 feet of the main span falling 108 feet into the 15-foot-deep river. A total of 111 vehicles were on the portion of the bridge that collapsed. Of these, 17 were recovered from the water. As a result of the bridge collapse, 13 people died, and 145 people were injured.”
The NTSB investigation identified the following: “insufficient Federal and State procedures for reviewing and approving bridge design plans and calculations; lack of guidance for bridge owners with regard to the placement of construction loads on bridges during repair or maintenance activities; exclusion of gusset plates in bridge load rating guidance; lack of inspection guidance for conditions of gusset plate distortion; and inadequate use of technologies for accurately assessing the condition of gusset plates on deck truss bridges.”
The I-35W bridge had been built in the early 1960s and opened to traffic in 1967. It was 40 years old at the time of its collapse. There had been multiple reports of fatigue cracking dating back to 1998 with a series of repairs conducted.
The age of the I-35W bridge is noteworthy because the ASCE’s 2013 report indicates that the Federal Highway Administration has calculated that more than 30 percent of U.S. bridges have exceeded their 50-year design life. According to the report, the “investment backlog for the nation’s bridges is estimated to be $121 billion, representing “all cost-beneficial bridge needs, not just the replacement or rehabilitation of eligible deficient bridges.”
It’s not just bridges that are screaming out for attention. ASCE’s 2013 report card found the following:
The number of deficient dams is currently more than 4,000.
“…much of our drinking water infrastructure is nearing the end of its useful life. There are an estimated 240,000 water main breaks per year in the United States. Assuming every pipe would need to be replaced, the cost over the coming decades could reach more than $1 trillion, according to the American Water Works Association (AWWA).”
“The Federal Aviation Administration (FAA) estimates that the [economic] cost of airport congestion and delays was almost $22 billion in 2012. If current federal funding levels are maintained, the FAA anticipates that the cost of congestion and delays to the economy will rise from $34 billion in 2020 to $63 billion by 2040.”
“…forty-two percent of America’s major urban highways remain congested, costing the economy an estimated $101 billion in wasted time and fuel annually. Federal Highway Administration estimates that $170 billion in capital investment would be needed on an annual basis to significantly improve conditions and performance.”
“…45% of American households lack any access to transit, and millions more have inadequate service levels…deficient and deteriorating transit systems cost the U.S. economy $90 billion in 2010…”
Making America great again means getting our priorities in order. Economic growth in the U.S. has been sputtering at 2 percent or less since the financial collapse in 2008. Investing in critical infrastructure is directly correlated to increasing GDP, employment, household income and export growth. A nation with almost $20 trillion in national debt simply can’t afford dubious wall building or insulting one of our largest trading partners.
