By Pam Martens and Russ Martens: July 9, 2021 ~
Former SEC Chair Jay Clayton
Donald Trump was inaugurated as President on January 20, 2017. But 16 days before Trump even took office, he sent the message to Wall Street that “I’ve got your back.” On January 4, 2017, Trump nominated Jay Clayton to Chair the Securities and Exchange Commission, ostensibly the top watchdog on Wall Street.
But Clayton’s resume ensured that he would be doing a lot more recusing than watchdogging. Clayton, a law partner at Sullivan & Cromwell, had represented 8 of the 10 largest Wall Street banks in the three years prior to his nomination.
Clayton did not disappoint. He looked the other way as the Wall Street banks traded their own bank’s stock in their own Dark Pools. He wore blinders as the Wall Street banks flagrantly violated the Dodd-Frank financial reform legislation’s Volcker Rule. He took no action to stop Wall Street from running its own private justice system (mandatory arbitration) that effectively locks the nation’s courthouse doors to Wall Street employees and customers. On May 5, 2020 Clayton’s SEC approved the application for some of the worst actors on Wall Street (such as Citadel, JPMorgan Chase, Citigroup, Goldman Sachs and others) to run their own stock exchange called “Members Exchange” or MEMX. We could go on and on but you get the picture.
And when it came to allowing Wall Street to pump out dodgy Initial Public Offerings, Clayton didn’t disappoint there either.

Professor Jay Ritter, Department of Finance, University of Florida
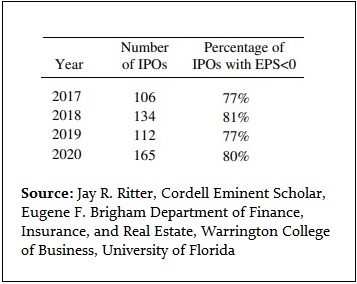
According to a study (see Table 9) released last month by Professor Jay Ritter in the Department of Finance at the University of Florida, there were more traditional IPOs with negative earnings issued in the four years of the Trump administration than at any time in the last 40 years. (The study only goes back to 1980.)
The study focuses on traditional IPOs and eliminates the following: “IPOs with an offer price below $5.00 per share, unit offers, ADRs, closed-end funds, partnerships, acquisition companies [SPACs], REITs, bank and S&L IPOs, and firms not listed on CRSP [Center for Research in Security Prices] within six months of the offer date are excluded.”
According to Ritter’s research, 77 percent of the traditional IPOs issued in 2017 had negative earnings; 81 percent in 2018; 77 percent in 2019; and 80 percent in 2020.
We could find no other era in the last 40 years that even came close to this disastrous record. For example, in the four years leading up to the historic dot.com crash in 2000, the percentage of IPOs with negative earnings looked like this: 36 percent in 1997; 46 percent in 1998; 76 percent in 1999; and 81 percent in 2000. That four-year average comes to 59.75 percent versus the four-year average from 2017 through 2020 of 78.75 percent of traditional IPOs coming to market with negative earnings.
And, of course, last year also set a record for companies coming to market with no businesses at all. We’re talking about Special Purpose Acquisition Companies (SPACs) that tap the public markets with an IPO when they have no commercial operations at all and simply plan to eventually acquire an existing company. SPACs are also known as “blank check” companies but could more accurately be called “blank brain” companies if one were to characterize the investor that buys in to this insanity.
According to FactSet, if you include SPACs and all types of IPOs, the total amount raised in 2020 through IPOs was $174 billion – which was a 150 percent increase over 2019. FactSet notes that SPACs accounted for half of all IPOs in 2020.
This IPO bonanza was wonderful for the bottom line of the mega banks on Wall Street that collected underwriting fees in the process, but as with the dot.com bust, the U.S. economy will pick up the price tag for this hubris.
Following the dot.com bust from 2000 to 2002, the Nasdaq stock index lost 78 percent of its value. Ron Chernow explained to New York Times’ readers on March 15, 2001 how America was paying the price for Wall Street’s excesses:
“Let us be clear about the magnitude of the Nasdaq collapse. The tumble has been so steep and so bloody — close to $4 trillion in market value erased in one year — that it amounts to nearly four times the carnage recorded in the October 1987 crash.”
Chernow explained that the Nasdaq stock market had performed as a “lunatic control tower that directed most incoming planes to a bustling, congested airport known as the New Economy while another, depressed airport, the Old Economy, stagnated with empty runways. The market functioned as a vast, erratic mechanism for misallocating capital across America,” Chernow observed.
But it wasn’t an “erratic mechanism” at all. It was a mechanism fueled by Wall Street’s personal greed and callous disregard for the good of the country. Just as today, the men pushing out those lemon companies as hot IPOs were doing it to make themselves and their bosses rich.
Following the dot.com bust, on April 28, 2003 the Securities and Exchange Commission settled charges for $875 million against 10 Wall Street banks that the SEC said had rigged the research they were disseminating to the public on IPOs. Investors lost more than $4 trillion but Wall Street got off with a payment of $875 million. No one went to jail. Just two individual research analysts were charged: Jack Grubman of Citigroup’s former Salomon Smith Barney unit and Merrill Lynch’s Henry Blodget. Both men were barred from future affiliation with a broker-dealer and paid fines that were a fraction of the bonuses they had collected.
The SEC did not stop these Wall Street banks from simultaneously bringing companies public and then issuing buy recommendations on the same stocks. The SEC simply made the underwriters spell out their fatal conflicts of interest. For example, the SEC’s settlement mandated that “Each firm will include a disclosure on the first page of each research report stating that it ‘does and seeks to do business with companies covered in its research reports. As a result, investors should be aware that the firm may have a conflict of interest that could affect the objectivity of this report.’ ”
When this current stock market bubble bursts and leaves the economy in ruins, Americans will look back on 20 years of Congressional failures to rein in the obscene greed and malfeasance on Wall Street that has dangerously impaired the United States from building legitimate new industries and innovations that will ensure good jobs for Americans in the future and the nation’s ability to compete on an increasingly competitive global stage.
Related Articles:
SEC Chair Jay Clayton Left Markets in the Biggest Mess Since 1929