By Pam Martens and Russ Martens: September 15, 2014
 Last Friday, the Dow Jones Industrial Average closed down a mere 61.49 points or 0.36 percent, but the overall market breadth (number of stocks advancing versus those declining) was abysmal. At the New York Stock Exchange, there were 666 stocks advancing versus 2,515 declining. Nasdaq showed 893 advancers versus 1,834 decliners.
Equally troubling for those who have jumped into stocks with both feet, Bloomberg News has a heart-stopper headline out today: “Record S&P 500 Masks 47% of Nasdaq Mired in Bear Market.” The article, by Lu Wang and Joseph Ciolli, advises that:
“Beneath the U.S. Stock market’s record-setting gains, trouble is stirring. About 47 percent of stocks in the Nasdaq Composite (CCMP) Index are down at least 20 percent from their peak in the last 12 months while more than 40 percent have fallen that much in the Russell 2000 Index and the Bloomberg IPO Index.”
This is not atypical of a tired bull facing serious headwinds. As the authors note, today’s market does not look all that different from the last market peak: “At the last market peak, losses across small-cap stocks, IPOs and technology companies were as widespread as they are today. About 45 percent of the shares were down at least 20 percent from a 52-week high in October 2007…”
A bull market with real legs should be lifting more boats. But despite the Standard and Poor’s 500 stock index setting new highs 33 times this year, the Bloomberg writers note that the Russell 2000 Index has delivered a negative return of 0.3 percent this year.
To put the whole matter in sharp perspective, what we actually have is a big cap bull market and a broad market rowing frantically against a rip tide. But as we know well from past Fed-fueled bubbles, things can get a lot frothier before the bubble pops.
The Fed’s long patch of historically low interest rates is not the only thing helping the big cap stocks levitate their market indices. As we previously reported, for calendar years 2006 through 2013, corporations authorized $4.14 trillion in buybacks of their own publicly traded stock according to data from Birinyi Associates. And they did it while simultaneously taking on more debt.
In just 2013, corporations authorized $754.8 billion in stock buybacks while borrowing $782.5 billion from credit markets. Jeffrey Kleintop, Chief Market Strategist for LPL Financial reports that corporations are now the single largest buying source for all U.S. stocks. The rapid pace of buybacks has continued into this year with Standard and Poor’s 500 corporations buying back approximately $160 billion in the first quarter.
Despite all the talk about the cash hoards that corporations are holding, MarketWatch columnist, Brett Arends, reported in August that U.S. non-financial corporate debt has risen from $7.2 trillion in 2007 (the year before the crash) to $9.6 trillion today, according to data from the Federal Reserve.
Putting aside the question of whether a corporation should be saddling itself with debt for no more innovative purpose than buying back its own shares, there is the question of what happens to stock buybacks (and new highs in the big cap stocks) when corporate bond buyers say “enough”!
It feels like the Federal Reserve may have also been thinking about this. In a truly unfathomable step, earlier this month the Fed and its fellow bank regulators ruled that the nation’s largest banks can hold corporate bonds and stocks in the Russell 1000 to meet liquidity needs in an emergency, along with the decidedly more liquid U.S. Treasury securities.
The Fed’s announcement comes as the corporate junk bond market is once again showing signs of strain. Barron’s Michael Aneiro reported Friday that “high-yield mutual funds and exchange-traded funds lost $766 million to investor withdrawals in the week ended Wednesday, following a $198 million loss the week before,” according to Lipper.
While that pales in comparison to the $7.1 billion withdrawn in a single week in early August, the chart below shows a worrisome trend. The fear is that the outflow from junk becomes an outflow that moves up the higher-rated corporate bond ladder.
If this is indeed what the Fed was thinking when it put corporate bonds on the liquidity list for the biggest banks, that’s the kind of market tinkering nobody wants to see from the nation’s central bank.
The Fed made another unusual move on Friday when it announced that it was forming an internal committee to be headed by Vice Chairman Stanley Fischer to oversee the work of its Office of Financial Stability Policy and Research. Fed Chair Janet Yellen already sits on the Financial Stability Oversight Council (FSOC) which includes the top representative of every bank regulator in the country.
On July 10, Fischer gave a speech in Cambridge, Massachusetts that appeared to question the structure of the FSOC, stating: “It may well be that adding a financial stability mandate to the overall mandates of all financial regulatory bodies, and perhaps other changes that would give more authority to a reformed FSOC, would contribute to increasing financial and economic stability.”
Congress created the FSOC under the Dodd-Frank financial reform legislation. It’s not clear where Fischer got his mandate to create a shadow FSOC.
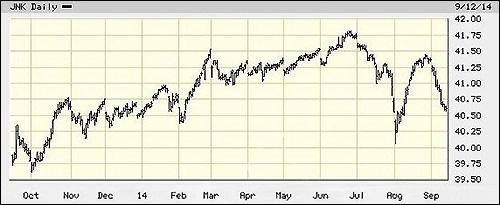
SPDR Barclays Capital High Yield Bond ETF (From BigCharts.com)