
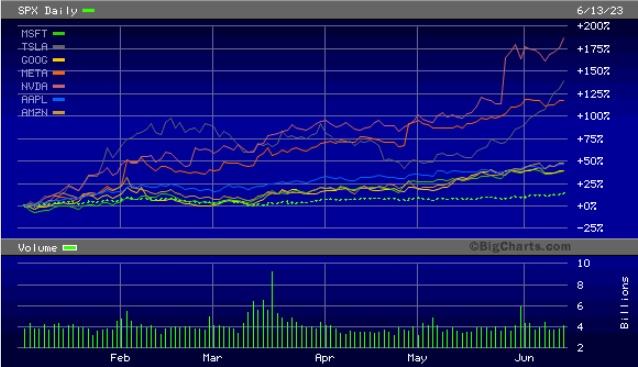
S&P 500 (SPX) YTD Performance Versus 7 Big Tech Stocks
By Pam Martens and Russ Martens: June 14, 2023 ~
Following the dot-com mania of the late 90s, the Nasdaq reached a closing high of 5,048.62 on March 10, 2000. The Nasdaq then proceeded to lose 78 percent of its value over the next 2-1/2 years. It reached a closing low of 1,114.11 on October 9, 2002.
There is mounting evidence that the S&P 500 is in a similar bubble today – this time fostered by Wall Street hyperbole and FOMO (Fear of Missing Out) around Artificial Intelligence (AI) boosting big gains at mega tech companies.
Headlines are sprouting up at various news outlets, touting that the S&P 500 is in a new bull market. But, in fact, almost all of the gains in the S&P 500 Index year-to-date have come from just seven stocks: Apple (ticker AAPL), Alphabet (GOOG), Amazon (AMZN), Meta Platforms (formerly Facebook, ticker META), Nvidia (NVDA), Microsoft (MSFT), and Tesla (TSLA).
The way that these seven stocks have been able to disguise the broad deterioration in the overall S&P 500 is that the Index is weighted by market capitalization. This translates into companies with very large market capitalizations (“market cap”) getting weighted more heavily in the pricing of the Index, meaning their share price movements can grossly distort the value of the S&P 500 Index, and thus, the overall view of the market.
To give you an idea of the size of the bubble we are in today, the market cap of Apple at yesterday’s closing bell was $2.88 trillion. That is more than the market cap of all domestic shares listed on the Frankfurt, Germany stock exchange as of March 2023.
This is a rundown of the market cap and Price-to-Earnings ratio (PE ratio) of these seven tech stocks, which are grossly distorting the value of the S&P 500 Index. (The data is as of yesterday’s closing prices.)
Apple: $2.88 trillion market cap; PE 31
Microsoft: $2.49 trillion market cap; PE 36
Alphabet: $1.58 trillion market cap; PE 27
Amazon: $1.3 trillion market cap; PE 295
Nvidia: $1.013 trillion market cap; PE 211
Tesla: $820 billion market cap; PE 74
Meta Platforms: $695 billion market cap; PE 33
Play close attention to the nose-bleed PE ratios of 295 on Amazon and 211 on Nvidia. The typical PE ratio is 20.
As of yesterday’s closing bell, the entire 500 stocks in the S&P 500 Index had a market cap of $36.48 trillion. If you add up the market cap of just the seven stocks listed above, it comes to $10.8 trillion or 29.6 percent of the entire 500 stocks in the index.
Adding to this market distortion, three of the seven tech stocks listed above have shown percentage gains of more than 100 percent year-to-date. Nvidia is up 180.7 percent; Meta Platforms has gained 125 percent; and Tesla is up 110 percent. This is decidedly not normal during a Fed tightening cycle.
In 2017, the veteran investor Warren Buffett, the CEO of Berkshire Hathaway, reminded investors about how critical the stock market’s ability to efficiently allocate capital is to America’s abundance. Buffet wrote this in his annual letter to shareholders:
“Above all, it’s our market system – an economic traffic cop ably directing capital, brains and labor – that has created America’s abundance. This system has also been the primary factor in allocating rewards.”
Unfortunately, Buffet was reflecting a nostalgic yearning for how he wished the U.S. markets still worked. He was not giving a realistic assessment of how U.S. markets are actually functioning.
From Dark Pools, to high frequency traders, to payment-for-order flow, to tricked up total return swaps allowing hedge funds to secretly pump and dump publicly-traded stocks (think Archegos), efficient allocation of capital has given way to a rigged wealth transfer system, sucking in the little guy at the top of markets as the insiders get their short positions in place.
