
By Pam Martens and Russ Martens: May 18, 2022 ~
The March 15-16 minutes of the Federal Open Market Committee (FOMC) of the Federal Reserve show that there was agreement, given “elevated inflation and tight labor market conditions,” that the Fed needed to take decisive action to shrink its balance sheet, with FOMC participants reaffirming “that the Federal Reserve’s securities holdings should be reduced over time in a predictable manner primarily by adjusting the amounts reinvested of principal payments….”
But Jerome Powell’s Fed did not actually announce a specific plan to shrink its balance sheet until May 4 and stated at that time that the plan would not go into effect until June 1 – almost three months after the FOMC indicated that the Fed should take decisive action.
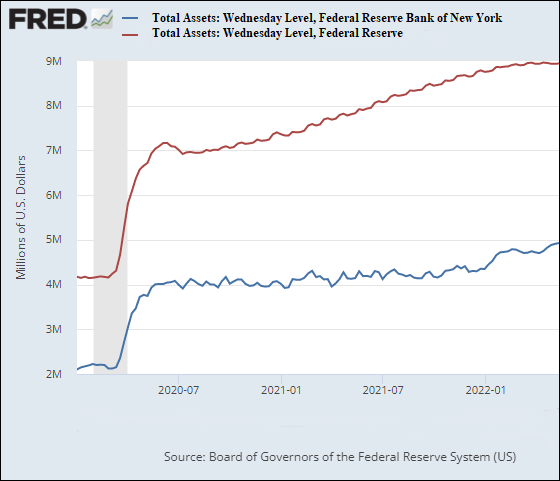
As a result of this stalling, the Fed’s balance sheet has remained at the $9 trillion level since its March 15-16 FOMC meeting, as inflation has continued to soar.
According to the Fed’s own H.4.1 weekly release of the details of its balance sheet, the Fed’s balance sheet stood at $9 trillion on March 16 and at $8.991 trillion on its last reporting date of May 11.
At Powell’s press conference on May 4, Michael McKee of Bloomberg Television and Radio specifically asked Powell “why did you decide to wait until June 1st to begin letting securities roll off and not start immediately in the middle of this month, say?” Powell responded with this evasive answer: “So why June 1, it was just ‘pick a date,’ you know, and that happens to be, that happened to be the date that we picked. It was nothing magic about it.”
Faced with the highest inflation readings in 40 years, the Fed’s stalling action until June 1 sent a message to markets that the Fed was falling even further behind on its mandate to control inflation. The Dow dropped 1,063 points the next day, a decline of 3.1 percent while the Nasdaq plunged 5 percent.
The largest components of the Fed’s balance sheet are the short and intermediate term U.S. Treasury bills and notes and long-term U.S. Treasury Bonds it has been buying up from Wall Street since it first launched its so-called “Quantitative Easing” or QE program following the Wall Street crash of 2008. To a smaller extent, QE also includes the Fed buying up bundles of federal-agency-backed mortgages (Mortgage Backed Securities, or MBS). As of last Wednesday’s H.4.1 release, the Fed’s balance sheet included $8.48 trillion in securities, of which Treasuries accounted for $5.766 trillion; MBS accounted for $2.7 trillion; and federal agency debt securities accounting for the balance.
The bulk of the Fed’s balance sheet resides at just one of its 12 regional Fed banks — the Federal Reserve Bank of New York, known simply on Wall Street as the New York Fed. Conveniently, the New York Fed is the only regional Fed bank to have its own trading floors with speed dials to Wall Street’s megabanks — one in New York and one stealthily added in Chicago near the futures exchange. (See The New York Fed Has Quietly Staffed Up a Second Trading Floor Near the S&P 500 Futures Market in Chicago.) Also, conveniently, the New York Fed oversaw the bulk of the Fed’s trillions of dollars in bailout programs to Wall Street during and after the 2008 financial crash as well as the trillions the Fed made in cumulative repo loans in 2019 and 2020. (Many trillions of dollars of those repo loans occurred in 2019, months before there was any pandemic.)
By the Fed buying up trillions of dollars in debt instruments from Wall Street, it is creating artificial demand that would not otherwise exist. This, in turn, pushes down interest rates and creates an artificial level of interest rates that would not otherwise exist.
The Fed’s artificially contrived “zero-bound range” of interest rates incentivized risk taking because it becomes easy for hedge funds and other speculators to obtain vast sums of money to gamble in markets at very low interest rates. (For more on that topic, see our report from April 13 of last year: Margin Debt Has Exploded by 49 Percent in One Year to $814 Billion. The Actual Figure May Be in the Trillions. Here’s Why.)
On September 23 of last year, the Federal Reserve released its Z.1 statistical release on the Financial Accounts of the United States. The section on “Corporate Equities” showed that at the end of 2019, the market value of all publicly-traded equities (stocks) in the United States had reached $38.47 trillion. By June 30, 2021, despite an ongoing pandemic, the market value of all publicly-traded stocks had surged to $54.768 trillion, an increase of 42 percent. (See page 130, Line 29 at this link.)
At $54.768 trillion, the U.S. stock market was larger than the combined GDP of the United States, China, Japan, Germany, France, Italy, Spain, and the U.K., according to GDP data from the World Bank.
The source of the leverage that is propping up this massive bubble is hiding out in the Wall Street megabanks which Congress allows to function as both trading casinos as well as the owners of the largest federally-insured commercial banks in the United States. These Wall Street megabanks provide margin loans to hedge funds (prime broker services) as well as disguise obscenely leveraged margin loans as total return swaps (derivatives) to family office hedge funds, as we learned with the implosion of Archegos Capital Management.
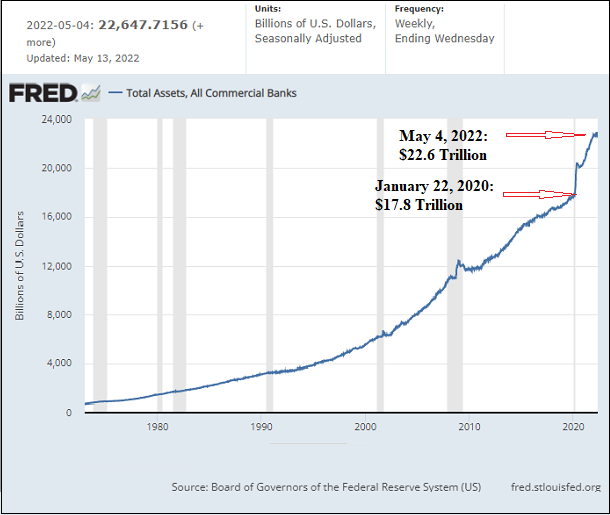
As the chart below indicates, the assets of all commercial banks in the U.S. stood at $12 trillion on June 3, 2009. It took eight years, to June 7, 2017, for those assets to grow by 35 percent and reach $16.2 trillion. But under Jerome Powell as Fed Chair, assets at commercial banks have exploded in just the past two and a quarter years, mushrooming from $17.8 trillion on January 22, 2020 to $22.6 trillion on May 4, 2022.
And thanks to the Fed’s history of rubber-stamping megabank mergers, as of December 31 of last year, just six bank holding companies (out of a total of 4,839 federally-insured commercial banks and savings associations) hold $13.699 trillion or 61 percent of all assets of all commercial banks. (That is the most dangerous concentration of risk in the history of federally-insured banking in the United States.) Those six bank holding companies are: JPMorgan Chase with $3.7 trillion in assets; Bank of America with $3.169 trillion; Citigroup with $2.29 trillion in assets; Wells Fargo with $1.9 trillion; Goldman Sachs Group with $1.46 trillion; and Morgan Stanley with $1.18 trillion. (Our asset data comes from page 19 of the quarterly report from the Office of the Comptroller of the Currency at this link.)
And not to put too fine a point on it, but those are the same six bank holding companies that control 89 percent of the $234 trillion in derivatives that have a habit of blowing up during every Fed rate-hiking cycle. (For the derivatives data, see the last link in the above paragraph.)
