New York Stock Exchange
By Pam Martens and Russ Martens: December 28, 2021 ~
On December 3 there were 585 new 52-week lows on the Nasdaq stock market versus 12 new 52-week highs. To look at it another way, 48.75 times more stocks were setting new 52-week lows than were reaching new 52-week highs. That doesn’t sound like the definition of a bull market to us. The Nasdaq had closed down just 1.9 percent that day.
Yesterday, the Nasdaq closed up 1.39 percent. We decided to check out the breadth of the market. Sure enough, even on an up day for the Nasdaq, there was negative breadth. There were 139 new 52-week highs but 203 new 52-week lows.
Against this pattern of a clearly deteriorating stock market picture came a raft of headlines yesterday touting that the S&P 500 Index had notched its 69th record close for the year. But here’s what you need to know about the S&P 500: it’s an index weighted by market cap and you have a handful of tech giants that dominate the market cap of the S&P 500 index. Alphabet’s share price (Google) is up 70 percent year-to-date; Microsoft is up almost 60 percent; and Apple is up 40 percent.
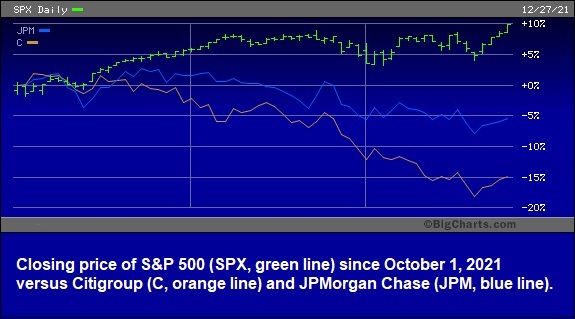
There has also been a deterioration in the share price of two megabanks on Wall Street. You can’t have a healthy stock market if the megabanks that lend to the largest corporations begin to struggle.
On Friday, October 1, Citigroup (ticker C) closed at a share price of $71.18. Yesterday, Citigroup closed at $60.65 – a decline of 15 percent in just under three months. JPMorgan Chase (ticker JPM), which has the dubious distinction of being both the largest bank in the United States as well as the only U.S. bank to admit to five felony counts in the past seven years, is down 5 percent in the same span of time. The S&P 500 Index (ticker SPX) is up 10 percent since October 1. (See chart below.)
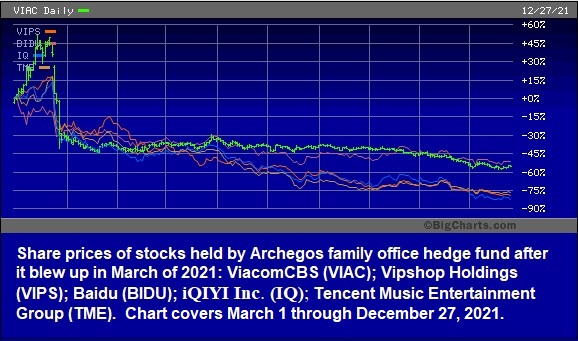
Then there is the question that remains unanswered by the ongoing investigation of the SEC into the Wall Street megabanks loaning out their balance sheets to family office hedge funds by providing as much as 85 percent margin loans so that these hedge funds can secretly take massively concentrated positions in a handful of stocks.
The chart below shows what has happened to the share prices of ViacomCBS (VIAC), Tencent Music Entertainment Group (TME), Vipshop Holdings (VIPS), iQIYI Inc. (IQ), and Baidu (BIDU) since March 1. Those were some of the concentrated stock positions held by the Archegos Capital Management family office hedge fund before it blew itself up on those 85 percent margin loans in late March.
What the SEC has yet to answer is the question, just how many more Archegos are lurking out there?