By Pam Martens and Russ Martens: August 31, 2020 ~
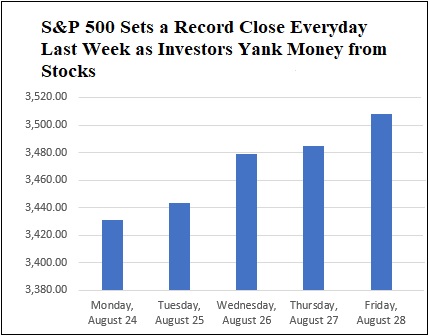
The S&P 500 stock index set a new record high on Friday, closing at 3508.01 – the first time it has ever closed above 3500. In fact, the S&P 500 set a record high close every single day last week. Here’s the actual closing numbers:
Monday, August 24: 3,431.28
Tuesday, August 25: 3,443.62
Wednesday, August 26: 3,478.73
Thursday, August 27: 3,484.55
Friday, August 28: 3,508.01
Refinitiv Lipper has been reporting fund flows into and out of the stock market for the past 18 years. According to Refinitiv Lipper, for the week ending Wednesday, August 26, stock (a/k/a equity) mutual funds and stock ETFs had a combined negative outflow of -$7.8 billion. For the week ending Wednesday, August 19, stock mutual funds and stock ETFs had a negative outflow of -$6.6 billion.
Put the two weeks together and you have investors yanking a net $14.4 billion out of stock funds. Where was the money going? For the most part, it was going into taxable bond funds.
So exactly how can a stock market index be setting new record highs when investors are cashing out and the majority of the stock components in the S&P 500 are far from their record highs?
The S&P 500 is made up of approximately 500 companies at any one time. The index is market capitalization weighted, a system that divides the market cap of a company by the index’s total market capitalization to determine its influence in the index.
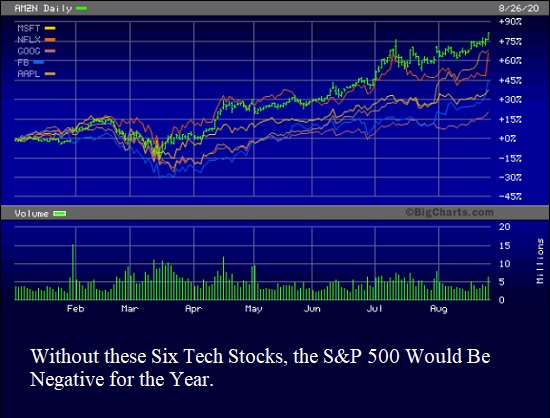
When you have six companies that have been dramatically outperforming other stocks this year, and just five of them (Alphabet (parent of Google), Amazon, Apple, Facebook, and Microsoft) make up more than 20 percent of the S&P 500’s total market capitalization, you can get an aberration in the pricing of the broader index.
To put it simply, were it not for these six stocks, the whole S&P 500 index would be negative for the year. DoubleLine’s Jeffrey Gundlach, a veteran market watcher, calls this “classic bear market rally activity.”
It is also known as “distribution” on Wall Street. That’s when the little guy is seduced into the stock market on the illusion that it is rocketing to one all time high after another. This gives the knowledgeable insiders that want out the necessary dumb money on which to dump their shares.
Here’s the crazy way these six stocks have been performing in the midst of the greatest economic crisis since the Great Depression. (We’re using closing prices on Wednesday, August 26, to coincide with the Rifinitiv Lipper funds flow report cutoff date):
Amazon closed the trading day on January 2, 2020, the first trading day of the year, at 1898.01. On Wednesday, August 26, it closed at 3,441.85 – an increase of 81 percent in less than 8 months.
On January 2, 2020, Apple closed the trading day at 300.35. On Wednesday, August 26, Apple closed at 506.09 – an increase of 68.5 percent.
Netflix, the streaming entertainment service, closed at $329.81 on January 2. It had spiked to $547.53 at the closing bell on August 26 – an increase of 66 percent.
In the same time span, Facebook soared from $209.78 to $303.91 – a gain of 45 percent. Microsoft went from $160.62 to $221.15 – a gain of 38 percent, while Alphabet, parent of Google, lagged the other five stocks with a gain of just 17 percent.
Could there be an invisible hand giving an artificial boost to these stocks? Our first thought was to check on what’s been going on in the Dark Pools. These are effectively unregulated stock exchanges that are bizarrely allowed to operate inside the large Wall Street banks. For the week of August 10, the latest week in which data is available at Wall Street’s self-regulator known as FINRA, Dark Pools owned by UBS, Credit Suisse, JPMorgan Chase, Goldman Sachs, Morgan Stanley (and numerous others) were active in trading every one of the above six high-flying stocks.
In addition, these same Wall Street banks are allowed to issue buy ratings on the stocks (which incentivizes their brokers to talk up the stocks to their customers). Despite the fact that the SEC found internal emails showing that the bank analysts were pushing stocks to the public that they were calling dogs and crap in internal emails during the leadup to the dot.com bust, the Wall Street banks have been allowed to continue issuing buy ratings on companies to whom they make loans, underwrite their stock and debt offerings, and opaquely trade their shares in Dark Pools.
For example, Amazon, the biggest highflier of the gang of six, currently has a “buy” rating from Goldman Sachs and UBS; an “overweight” rating from JPMorgan and Morgan Stanley; and an “outperform” rating from Credit Suisse, just to mention a few of those banks that are also trading its stock in their internal Dark Pools.
How long can a frothy bubble last? Much longer than common sense would suggest, especially when the Fed keeps spiking the punch bowl with zero interest rates and trillions of dollars in bailouts. How long can Congress ignore the rigged structure of the stock market? Until Wall Street billionaires are no longer allowed to contribute obscene sums of money to Presidential and Congressional campaign committees.