
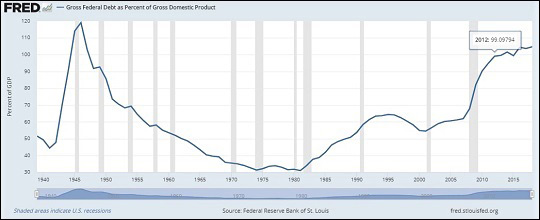
Gross Federal Debt as a Percent of GDP, January 1, 1939 to January 1, 2018 (Source: Federal Reserve Bank of St. Louis)
By Pam Martens and Russ Martens: June 12, 2019 ~
The two greatest stock market crashes that triggered deep economic upheaval in the U.S. occurred from 1929 to 1932 and from 2008 to 2009. There has long been a debate as to why the 1929 crash was followed by a Great Depression while the 2008 epic crash, which took down century-old iconic names on Wall Street along with the U.S. housing market and labor market, was followed by a less severe Great Recession.
Another debate about those two periods is why the stock market, as measured by the Dow Jones Industrial Average, took a quarter-century to regain the peak it had set in 1929 while the stock market returned to the peak it had set in 2007 just six years later. (See charts below.)
We believe the answer is found in one word – debt.
On January 1, 1939, after more than nine years of the Great Depression and staggering unemployment, the U.S. Federal debt stood at just 51.58 percent of Gross Domestic Product. (The debt climbed to over 100 percent of GDP during the U.S. engagement in World War II but then declined sharply over the next three decades. See chart above.) But after the 2008 Wall Street collapse, Federal debt as a percent of GDP climbed rapidly, rising to 82 percent on January 1, 2009; to 99 percent on January 1, 2012; and climbing further to 105 percent as of October 1, 2018.
Expressed as U.S. dollars, the growth in our nation’s debt is staggering. At the end of the third quarter of 2001, while George W. Bush was president, the U.S. national debt stood at $5.8 trillion. On the same date in 2008, four months before Barack Obama assumed the presidency, the national debt stood at $10 trillion. Four months before Obama left office, the national debt stood at $19.57 trillion, just shy of a doubling of the national debt in just eight years. As of this morning, the Federal debt stands at 22.37 trillion.
In effect, Wall Street was bailed out by unprecedented fiscal stimulus (deficit spending by the U.S. government) along with an unprecedented and secret $29 trillion in below-market-rate loans from the Federal Reserve.
Unlike after World War II when the debt began to immediately decline, the U.S. debt has dramatically climbed throughout this current period of a so-called economic and stock market “recovery.” This raises the question as to just how much of this recovery has been built on debt; what the living standard will be for the next generation if we don’t get this escalating debt under control; and what will be the economic impact and stock market response to the inevitable popping of this giant debt bubble.
The stock market currently appears to be addicted to debt in much the same way that a junkie craves a fix. Just look at how the Dow Jones Industrial Average behaved in 2017 in anticipation of a massive Trump tax cut that the market understood would dramatically increase the Federal debt. The Dow started 2017 in the 20,000 range. In March it broke through 21,000. In August of 2017, it broke through 22,000. By October it had broken through 23,000. The tax bill was introduced in Congress on November 2, 2017 and signed into law on December 22, 2017. Before the year was out, the Dow had broken through 24,000. As of yesterday’s close, it stood at 26,048.51.
The worst part of this scenario is that the U.S. Congress has failed to prevent a repeat of another epic Wall Street crash and a renewed demand by Wall Street to be bailed out by the taxpayer or it will take down the U.S. economy and 401(K) retirement plans. At a House Financial Services Committee hearing on May 16 of this year, Congressman Brad Sherman had the following exchange with Randal Quarles, the Federal Reserve’s Vice Chairman for Supervision of the largest bank holding companies – the same banks that blew up the financial system in 2008 but are now much more dangerous in terms of concentrated risks.
Sherman: Mr. Quarles, I think you probably regulate the biggest of the big. Can you guarantee us that no one institution will be able to call the White House or Congress and say ‘we’re going down, and when we go down, we’ll bring down a chunk of the economy with us.’ They did that 10 years ago. Can we just hang up on them now if they make that call. And don’t tell me it’s unlikely to happen, because, trust me, your predecessor’s predecessor told us in 2007 it wasn’t going to happen.”
Quarles: “There have been substantial improvements in the resolvability of all of the large institutions.
Sherman: So, can you guarantee if they call, we can hang up the phone. You’re not gonna be here saying, oops, you better pass TARP II.
Quarles: What I can guarantee is the changes that have been made will give policy makers, including the Congress, more options than existed 10 years ago…
Sherman: For those of us who lived through it, that’s not a whole lot of comfort. We can guarantee that if we break up the too-big-to-fail institutions. And I’m still looking for co-sponsors, particularly bipartisan co-sponsors, on that effort.
The U.S. is at one of the most crucial and dangerous crossroads in its history. It can succumb to the pleas of the bailout boys. (See Bernanke, Paulson, Geithner Wrap Themselves in the Heroic Garb of Firefighters to Lobby for Another Wall Street Bailout). Or it can restore the Glass-Steagall Act of 1933 which protected the U.S. financial system for 66 years until its repeal under the Clinton administration in 1999. Restoring Glass-Steagall would separate the high-risk investment banks and brokerage firms from the nation’s commercial banks which hold Federally-insured (taxpayer-backstopped) deposits.
The epic 1929 stock market crash and economic upheaval occurred when there was no Glass-Steagall Act. The seismic 2008 financial crash also occurred when there was no longer any Glass-Steagall Act protecting the financial system. That should tell you all you need to know on this issue.
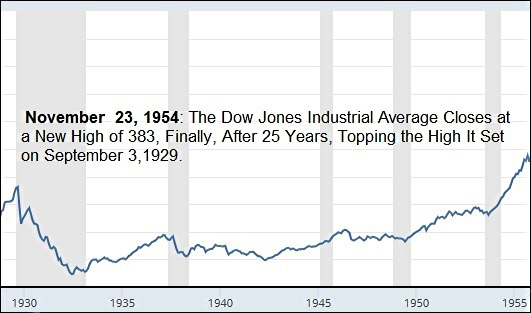
Dow Jones Industrial Average, 1929 to 1954
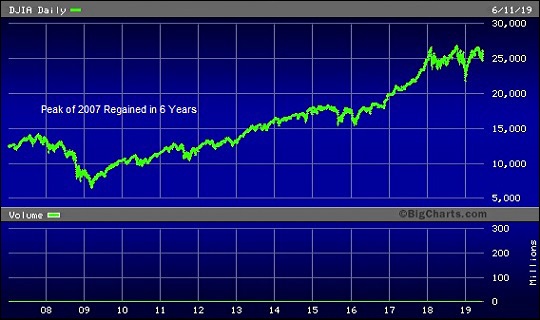
Dow Jones Industrial Average January 1, 2007 to Present; Market Regains the Peak It Set Prior to the Financial Crash in Just 6 Years
