
By Pam Martens and Russ Martens: June 26, 2018 ~
Over the past week, everyone from the New York Times to Mother Jones is writing about the yield curve – a topic previously considered so esoteric by newspaper editors that only an economic nerd of a reporter would dare suggest writing a story about it.
The concern today is that the yield curve (a measure of short, intermediate and long-term interest rates) is getting very close to inverting. An inverted yield curve occurs when short rates are higher than longer term rates. Under normal circumstances, an investor should be rewarded with a higher yield for taking greater risk in buying a longer-dated bond since future inflation would erode his purchasing power from the interest payments on the longer bond over time.
At Wall Street On Parade, we’ve been calling our readers’ attention to what’s happening with the yield curve since November of last year for the simple reason that an inverted yield curve is an economic window into the future of the U.S. economy (reliably predicting past recessions including the 2001 meltdown and the epic collapse in 2008-2009). When the next recession hits, it will come at a time of unprecedented debt levels in the U.S. and a Wall Street banking sector that has, once again, loaded up on opaque derivatives exposure. That raises the stakes for more Wall Street bank implosions and, as a consequence, it raises the stakes for your financial well being.
Getting your personal finances in shape now to protect yourself and your family is a prudent course of action. That includes having adequate savings to see you through a potential job layoff and getting credit card debt under control. It also means minimizing risk in your 401(k) and/or other retirement accounts by not having all of your nest eggs in the stock market or risky corporate bonds.
Here’s how the spread (difference in yield) between the 10-year U.S. Treasury note and 30-year U.S. Treasury bond has shrunk since November 9, 2017, edging ever closer to inverting: On the morning of November 9, 2017 the spread stood at 48 basis points with the 10-year yield at 2.33 percent and the 30-year yield at 2.81 percent. Last month we looked at the spread again on the morning of May 16. The spread had shrunk to a tiny 13 basis points with the 10-year yield at 3.06 percent and the 30-year yield at 3.19 percent. That spread hasn’t changed much since last month, standing this morning at 7:50 a.m. at 15 basis points.
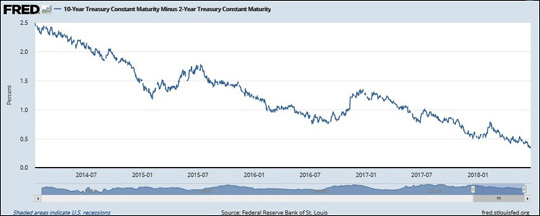
The chart above from the Federal Reserve Bank of St. Louis shows just how extraordinary the interest rate environment has been under the unprecedented micro-managing by central banks to shore up the global economy following the Wall Street collapse of 2008 and Great Recession that followed. On January 14, 2014 the yield on the 2-year Treasury note stood at 0.39 percent while the 10-year Treasury note yielded 2.88 percent – a whopping spread of 249 basis points. As of 8:33 a.m. this morning, that spread stood at a miniscule 34 basis points with the 2-year Treasury yielding 2.53 percent and the 10-year at 2.87 percent.
The Federal Reserve, of course, has helped to push up yields at the short-end of the yield curve. Since December 2015, the Fed has raised rates seven times, moving glacially from a zero-range policy that prevailed from December 16, 2008 to December 16, 2015 by making only 0.25 percent moves each time it hiked. Its latest rate move occurred on June 13 when it hiked its benchmark overnight funds rate to a range of 1.75 percent to 2 percent.
If you want to have a greater understanding of how things might play out on Wall Street and the U.S. economy in the next downturn, we highly recommend reading Nomi Prins new book Collusion: How Central Bankers Rigged the World. The U.S. Fed and other global banks were using trillions of dollars of money they “conjured” up by pushing an electronic button to buy up bonds (and in some foreign central bank cases, stocks) that were overproduced by big Wall Street banks and their global counterparts in the bubble that led to the 2008 crash. Through central banks willingness to sop up the banks’ bad bets and excesses, Wall Street had the money to go on a spending spree.
Prins warns that the largest Wall Street banks “that inhaled this cheap money were not required to increase their lending to the Main Street economy as a condition of the availability of that money…Wall Street used its easy access to cheap money to increase speculation in derivatives and other complex securities. They used it to buy back their own shares, thus effectively manipulating their own stock – in broad daylight and with explicit approval from the Fed.” Equally problematic writes Prins, “these banks dialed back their lending to small and midsized businesses, which hampered their growth potential.”
