
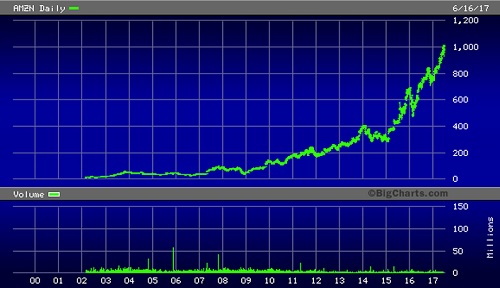
Amazon Stock Price Chart Since 2002
By Pam Martens and Russ Martens: June 19, 2017
Mark this date on your calendar: Friday, June 9, 2017. That’s the date that the big downward move in the largest tech stocks began. The day also saw a rotation into big bank stocks (which is like swapping a land mine for a hand grenade — there’s going to be an explosion, it’s just a matter of degree).
The selloff on Friday was triggered by a research report from Robert Boroujerdi of Goldman Sachs. The report compared today’s FAAMG tech stocks (Facebook, Apple, Amazon, Microsoft and Google-parent Alphabet) to the highfliers in the tech bubble that crashed in 2000: Microsoft, Cisco, Intel, Oracle and Lucent.
Boroujerdi used a lexicon that the market did not want to hear: “death,” “extremes,” and “difficult to decipher risk narratives.” The exact sentence went like this:
“This outperformance, driven by secular growth and the death of the reflation narrative, has created positioning extremes, factor crowding and difficult-to-decipher risk narratives (e.g. FAAMG’s realized volatility is now below that of Staples and Utilities).
Let’s pause for a moment to examine the concept that a tech stock’s volatility could, rationally, be lower than “Staples and Utilities”. Consumer staples are things we buy regardless of boom or bust in the economy. For example, most of us have favorite brands of coffee, toothpaste, laundry detergent and the like that we will continue to buy even when money is tight and the economy is in recession. The same idea applies to utilities. We’ll pay our water and electric and telephone bills because we consider these utilities necessities. Buying an expensive new iPad or shopping for discretionary spending items online at Amazon have as much in common with staples and utilities as apples and oranges have to do with landscaping shrubs.
The reason for the low volatility is not because these tech stocks are the perfect vehicles for widows and orphans. It’s because hedge fund managers and mutual funds have crowded into these five names. According to the Goldman report, the five FAAMG tech stocks have increased their market value by $600 billion this year, accounting for approximately 40 percent of the year-to-date performance of the entire 500 stocks that make up the Standard and Poor’s 500 Index.
The Goldman research report suggested this low volatility could lull investors into a dangerous slumber, writing:
“We believe low realized volatility can potentially lead people to underestimate the risks inherent in these businesses including cyclical exposure, potential regulations regarding online activity or antitrust concerns or disruption risk as they encroach into each other’s businesses.”
Unless you’re very rich, you likely didn’t hear Goldman Sachs ring the warning bell on tech stocks on June 9 or get its research report. (In 2013, the New York Times reported that Goldman required a $10 million minimum to manage private wealth and was booting its own employees’ brokerage accounts if they were less than $1 million.)
The worry about big cap tech stocks continued last week with big selloffs on Monday, Tuesday and Thursday.
Goldman Sachs’ Chief U.S. Equity Strategist, David Kostin, added more fuel to the fire the prior week by sending out a note to clients titled: “Goldilocks and the Three Hikes: A Fairy Tale Scenario Behind the Tech Stock Rally.” Kostin wrote:
“The unexpected mix of healthy growth and declining rates represents a Goldilocks scenario for U.S. equities. However, just like in the fairy tale, this perfect scenario is unlikely to last.”
Speaking of fairy tales, the U.S. Treasury note and bond market hasn’t been buying this strong growth tale for quite a long time. This morning, the 10-year U.S. Treasury Note is yielding 2.17 percent while 20 years further out the yield curve the 30-year U.S. Treasury Bond is at a decidedly tepid yield of 2.78 percent.
