By Pam Martens: March 18, 2015
 Yesterday, an agency of the Federal government, the U.S. Treasury’s Office of Financial Research (OFR), released a study warning that by three separate measures the U.S. stock market is approaching dangerous “two-sigma thresholds” which can lead to “quicksilver markets.” Translation: we could be heading for a big crash.
A two-sigma threshold is when market valuation metrics move at least two standard deviations above the historical mean. The study notes that “valuations approached or surpassed two-sigma in each major stock market bubble of the past century.” Think 1929, 2000 and 2007. A quicksilver market, as defined by the study, is when stable markets turn on a dime and “change rapidly and unpredictably.”

Theodore (Ted) Berg, Chartered Financial Analyst with Treasury’s Office of Financial Research
The study was authored by Theodore (Ted) Berg and notes that it may not necessarily reflect the official position or policy of the OFR or Treasury. Berg is a Chartered Financial Analyst with the OFR, an agency created under the Dodd-Frank Wall Street Reform and Consumer Protection Act of 2010.
The three measures that are flashing warning signals are the CAPE ratio, the Q-ratio, and the Buffett Indicator. Berg is looking at these measures because of the potential for today’s historically high profit margins to be distorting the outlook of other analysts who are predicting that trend to continue, when, in reality, profit margins “revert toward a longer-term average over a business cycle.”
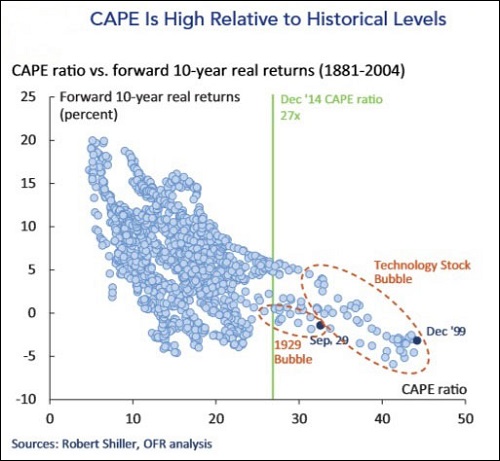
The CAPE ratio was devised by economist Robert Shiller. It’s the ratio of the S&P 500 index to trailing 10-year average earnings, capturing a more realistic trend over one or two business cycles and thus eliminating the bias of one year of aberrational profits.
Looking at the market through the eyes of CAPE, Berg has this to say:
“The historical CAPE average based on a 133-year data series is approximately 17 times, and its two-standard-deviation upper band is 30 times. The highest market peaks (1929, 1999, and 2007) either surpassed or approached this two-sigma level (1999 exceeded four sigma). Each of these peaks was followed by a sharp decline in stock prices and adverse consequences for the real economy. At the end of 2014, the CAPE ratio (27 times) was in the 94th percentile of historical observations and was approaching its two-sigma threshold.”
The Q-Ratio removes financial corporations from the measurement because these contributed to excessive valuations in the mid-2000s. The study defines the measurement as “the market value of non-financial corporate equities outstanding divided by net worth.” Under this measurement, equity valuations are “approaching critical levels,” according to the study.
The Buffett Indicator has been said to be a measure used by Berkshire Hathaway Chairman Warren Buffett to gauge market valuation. It’s the ratio of corporate market value to the U.S. Gross National Product (GNP). It is now at its highest level since the tech bubble crash in 2000.
The study is quick to note that none of these three gauges predict “the timing of inflection points,” and the market could remain overvalued for a long period. Berg references the fact that in December 1996 the stock market was at a CAPE of 28, flashing red, but the “S&P 500 more than doubled over the next three years, with valuations reaching all-time highs in March 2000.”
It might be relevant today to recall just why those valuations became so stretched in the three-year lead up to the 2000 crash. There were Wall Street hucksters like Jack Grubman of Citigroup issuing fraudulent reports on tech companies to pump their market valuations and garner investment banking business for Citigroup. (Read the SEC complaint here.)
When the bubble finally burst, the S&P 500 index lost almost 50 percent while the Nasdaq, home to Grubman’s tech picks, lost almost 80 percent. As investors learned then, and again in 2008, there is a hefty price to pay for ignoring flashing alarm bells. And yet, according to the study, “today’s high stock valuations imply that investors underestimate the potential for uncertain events to occur.” To put it in layman’s terms, investors are ignoring that this market can make unpredictable, large gyrations at warp speed, potentially wiping out trillions of dollars of life savings.
The study next looked at the ramifications to financial stability in the U.S. should another major bubble burst. It found that today’s vulnerabilities that could amplify a market shock include “leverage, compressed pricing of risk, interconnectedness, and complexity.” On the subject of leverage, Berg noted the following:
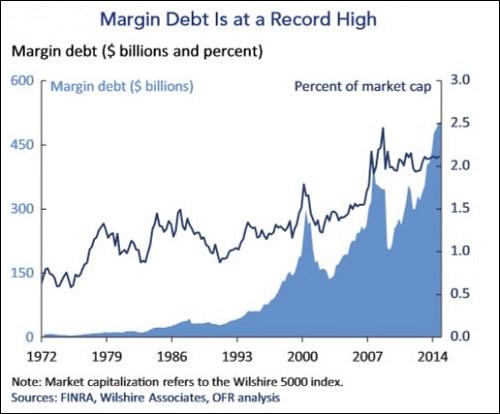
“Leverage can magnify the impact of asset price movements. Leverage achieved through stock margin borrowing played an important role in inflating stock prices in the 1929 stock market bubble and to a lesser extent in the late 1990s technology stock bubble. Margin debt, according to the Financial Industry Regulatory Authority, reached a record $500 billion at the end of the third quarter of 2014, representing just over 2 percent of overall market capitalization. Although this percentage is below the peak in 2008, it is higher than historical levels. The percentage does not appear alarmingly high, but forced sales of equities by large leveraged investors at the margin could be a catalyst that sparks a larger selloff.
“Other forms of leverage, such as securities lending and synthetic leverage achieved through derivatives, may also present risks. Another component of leverage in the system is the financing activities of corporations. Today, high profits have made corporate balance sheets generally quite healthy. As of the third quarter of 2014, U.S. nonfinancial corporations held a near-record $1.8 trillion in liquid assets (cash and financial assets readily convertible to cash). However, corporations also have racked up a record amount of debt since the last crisis. U.S. nonfinancial corporate debt outstanding has risen to $7.4 trillion, up from $5.7 trillion in 2006. Proceeds from debt offerings have largely been used for stock buybacks, dividend increases, and mergers and acquisitions.
“Although this financial engineering has contributed to higher stock prices in the short run, it detracts from opportunities to invest capital to support longer-term organic growth. Credit conditions remain favorable today because of the positive trend in earnings, but once the cycle turns from expansion to downturn, the buildup of past excesses will eventually lead to future defaults and losses. If interest rates suddenly increase, then financial engineering activities will subside, removing a key catalyst of higher stock prices.”
The full report can be read here.
Editor’s Note: This article has been corrected to show that the study reported that it was December 1996, not December 1999, when the CAPE reached a reading of 28.