
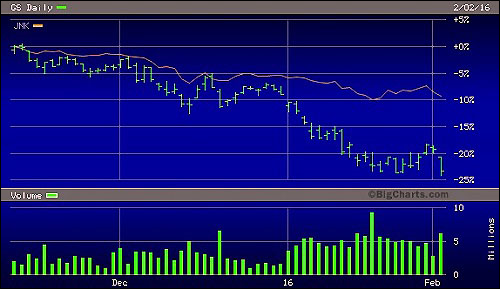
Goldman Sachs’ Share Price Versus SPDR Barclays High Yield Bond ETF (Goldman Is the Green Line; the ETF Is Orange.)
By Pam Martens and Russ Martens: February 3, 2016
Most folks don’t realize that on Monday, September 23, 2013, Goldman Sachs began trading as one of the 30 stocks in the Dow Jones Industrial Average Index (Dow). Because the Dow is stock-price weighted and Goldman sports a very high price, it has an outsized impact on point gains and losses in the index. As of yesterday’s close, Goldman Sachs is the priciest stock in the Dow, despite its plunging price of late.
Yesterday, the Dow lost 295.64 points and Goldman Sachs was a major contributor to the decline, losing 4.98 percent of its share price to close at $151.70. If this keeps up, it might not be too long before you see Goldman yanked from the Dow.
The percentage loss in Goldman yesterday was notable on multiple fronts. First, its percentage decline was 3.18 percent more than the loss in the Dow, which gave up just 1.80 percent. Goldman’s percentage decline was also higher than two other components of the Dow which saw negative ratings action yesterday from Standard and Poor’s. Chevron had its debt rating cut one notch from AA to AA- while Exxon was put on a negative ratings watch, which could mean its much-ballyhooed AAA-rating could get nicked. (As a barometer of just how bad things are in the land of collapsing oil prices, Exxon made it through the Great Depression without a credit downgrade from S&P.)
But the biggest oddity in Goldman Sach’s price action yesterday was how it performed versus the SPDR Barclay’s High Yield Bond Exchange Traded Fund, a portfolio of junk bonds whose stock symbol is JNK. The ETF closed down just 0.82 percent versus Goldman’s big percentage decline of 4.98 percent. Clearly, something is seriously wrong in how today’s markets are pricing risk or transparency at the mega banks is as clear as mud. (See related articles below for more insight into this matter.)
Other big Wall Street bank stocks performed miserably also yesterday. Bank of America closed down by 5.23 percent; Citigroup was off by 4.85 percent; while Morgan Stanley closed down 4.71 percent – all sporting a dramatically higher price decline than the broader market indices.
What’s got investors so worried about these Wall Street behemoths that they’re trading worse than a junk bond portfolio? We believe it’s the following: as the Office of Financial Research has reported, these banks are highly interconnected to one another. (See chart below.) Just how interconnected they are we really don’t know. Investors worry that we might not fully grasp the counterparty risk until there is another implosion like that of 2008. Think of the card game, Old Maid. Some of these banks with opaque over-the-counter derivatives exposure may be showing a calm face to the public while trouble is simmering in their books.
Another barometer of trouble brewing is the yield on the 10-year U.S. Treasury note. When the Fed first hiked its interest rate on December 16 of last year, the 10-year note closed at a yield of 2.29 percent. With persistent Fed talk of more rate hikes on the basis of an improving economy since then, one would have expected the 10-year to trend higher or at least hover in the same range. Instead, the 10-year yield has been dropping to close at 1.87 percent yesterday. That is another serious red flag that investors are seeking a safe haven from risks that are known — or the iceberg below the water that they can’t see but suspect is there.
The tragedy in all of this is that confidence in the market’s transparency has been drained by Congress and President Obama deciding in the 2010 financial reform legislation to put the Federal Reserve in charge of the mega bank holding companies after it had failed to properly police these entities in the period leading up to the 2008 crash. Investors may not fully grasp the details of what went wrong then and what is wrong now but their gut instinct is that the business model of Wall Street is not just fraud as Senator Bernie Sanders says, but the regulatory model employed by the President and Congress is to reward failure. That’s a combustible mixture.
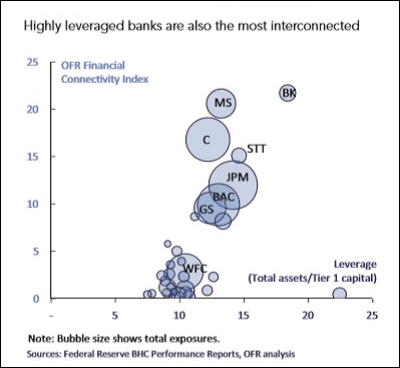
Wall Street Mega Banks Are Highly Interconnected: Stock Symbols Are as Follows: C=Citigroup; MS=Morgan Stanley; JPM=JPMorgan Chase; GS=Goldman Sachs; BAC=Bank of America; WFC=Wells Fargo.
Related Articles:
5 Wall Street Banks Have Lost $219.7 Billion in Market Cap in 7 Months
Hoenig: Wall Street Banks “Excessively Leveraged” at 22 to 1 Ratios
What We Don’t Know About the Biggest Wall Street Banks Could Kill the Economy – Again
Pull Back the Curtain on Exchange Traded Funds and Out Pop Wall Street Mega Banks
Wall Street’s Oil and Commodities Empire Under Investigation by U.S. Senate
