
By Pam Martens and Russ Martens: April 28, 2015
If you’ve been scratching your head since the middle of last year as consumer confidence surveys depicted an optimistic, eager to spend consumer while other hard economic data was showing a sputtering economy, we’re here to put your mind to rest. You’re not crazy. The U.S. economy is dramatically diverging from where most consumers think it is and we have three charts to prove it.
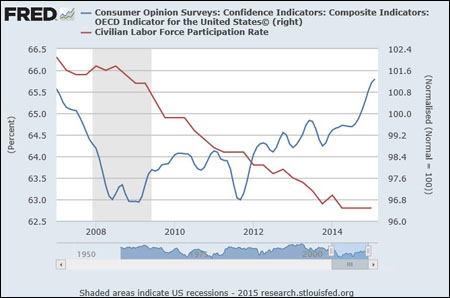
Most Americans have never heard of the Labor Force Participation Rate. Consumers judge the availability of jobs, or lack of them, by the Unemployment Rate that is fed to them in newspaper headlines and TV sound bites monthly. The Unemployment Rate has been coming down nicely and fueling positive vibes among consumers.
Unfortunately, the Labor Force Participation Rate, which measures the number of people who are either employed or actively looking for a job has been hitting historic low numbers, suggesting far more slack in the labor market than captured by the official Unemployment Rate.
On February 4, Jim Clifton, Chairman and CEO of Gallup, told a stunned interviewer at CNBC that he was concerned he might “suddenly disappear” and not make it home that evening if he disputed the reliability of what the U.S. government is reporting as unemployed workers. Clifton’s concerns are essentially based on the fact that consumer confidence and Fed jawboning on when it’s going to hike interest rates to slow down this “strong” U.S. economy before it overheats is about all the U.S. has left in its monetary arsenal.
Clifton had penned an opinion piece on the company’s web site which punctured the rosy spin on the improving jobs market. Clifton wrote:
“Right now, we’re hearing much celebrating from the media, the White House and Wall Street about how unemployment is ‘down’ to 5.6%. The cheerleading for this number is deafening. The media loves a comeback story, the White House wants to score political points and Wall Street would like you to stay in the market.
“None of them will tell you this: If you, a family member or anyone is unemployed and has subsequently given up on finding a job — if you are so hopelessly out of work that you’ve stopped looking over the past four weeks — the Department of Labor doesn’t count you as unemployed…Right now, as many as 30 million Americans are either out of work or severely underemployed…
“There’s another reason why the official rate is misleading. Say you’re an out-of-work engineer or healthcare worker or construction worker or retail manager: If you perform a minimum of one hour of work in a week and are paid at least $20 — maybe someone pays you to mow their lawn — you’re not officially counted as unemployed in the much-reported 5.6%. Few Americans know this.
“Yet another figure of importance that doesn’t get much press: those working part time but wanting full-time work. If you have a degree in chemistry or math and are working 10 hours part time because it is all you can find — in other words, you are severely underemployed — the government doesn’t count you in the 5.6%. Few Americans know this.” (Read the full article here.)
What Americans don’t know about the real labor market is captured in the chart above showing a massive divergence between the growing number of Americans not in the labor force versus consumer confidence.
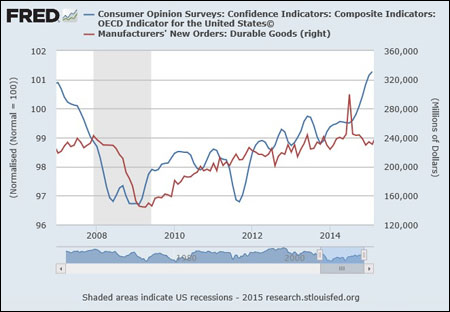
Then there is the divergence between consumer confidence and spending on big ticket items, i.e., durable goods, items expected to last for three or more years. A healthy consumer should be committing to buying refrigerators, washing machines, computers, etc. But check out the chart below showing the dramatic divergence between consumer confidence and durable goods orders.
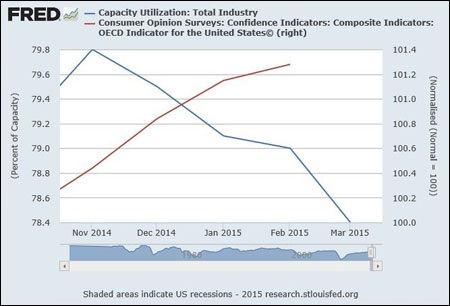
Finally, there is the capacity utilization rate’s dramatic divergence from consumer confidence readings. Our capacity utilization chart below measures the percentage at which total industry in the United States is operating. A falling percentage rate means there is growing slack in the economy. If business is running at 78.4 percent of its capacity, that means there is room to grow 21.6 percent before there is need to build a new plant. Clearly, a declining level of capacity utilization is nothing to cheer about for consumers who are actually paying attention.
There is anecdotal evidence that the typical consumer is heavily influenced by the media. If you look at our first chart above, you will see a stark plunge in consumer confidence in the latter part of 2011. That plunge coincides with media coverage of the Occupy Wall Street protests and occupation of Zuccotti Park in lower Manhattan between September 17, 2011 and November 15, 2011. The protestors focused Americans’ attention on how Wall Street got “bailed out” and the rest of us got “sold out,” and the vast income and wealth inequality between the 1 percent versus the 99 percent. That kind of talk was clearly not good for consumer confidence and it was brutally eradicated in a vicious raid by police in the early morning hours of November 15. We wrote about the specifics of the brutality against both protesters and the press in this report.
The bottom line of all of this is that the typical consumer in America is tethered to snippets of information emanating from newspaper headlines and television. If you genuinely want to know what’s coming down the pike in this economy, forget the consumer confidence readings and look at the hard data.
