By Pam Martens and Russ Martens: December 8, 2017
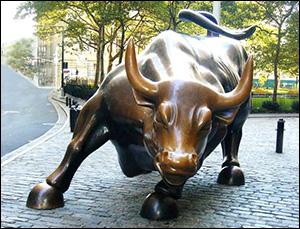
Wall Street Bull Statue in Lower Manhattan
Some of the same warning signs that emerged before the 1929 to 1933 market crash, the tech mania crash of 2000, and the epic Wall Street meltdown of 2008 are flashing red.
If you have significant amounts of your 401(k) invested in equity mutual funds (that is, those invested in stocks), it’s time to take an objective appraisal of today’s market versus historic benchmarks.
This is also a good time to remember that markets have lost as much as 50 percent of their value from peak to trough in the last 20 years. If that’s more pain than you’re prepared to suffer, it may be time to trim back your exposure.
We’ll get to the specifics on today’s market shortly, but first some necessary background.
In the market crash of 1929 to 1933, the stock market lost 90 percent of its value. It did not return to the level of 1929 until 1954 – a quarter of a century later.
There is some basis to speculate that the bear market of October 2007 to March 2009, which included the epic Wall Street crash of 2008, would have produced far more serious pain than the 50 percent retracement in the S&P 500 that did occur – perhaps pain on the level of 1929 to 1933 – had it not been for the secret $16 trillion in almost zero-interest loans that the Federal Reserve Bank of New York sluiced into the major brokerage firms on Wall Street — which was on top of the hundreds of billions of dollars in bailout funds that were authorized by Congress.
In a March 3, 2015 Senate Banking Committee hearing, Senator Elizabeth Warren had this to say about the secret loans made by the Fed:
“Now, let’s be clear, those Fed loans were a bailout too. Nearly all the money went to too-big-to-fail institutions. For example, in one emergency lending program, the Fed put out $9 trillion and over two-thirds of the money went to just three institutions: Citigroup, Morgan Stanley and Merrill Lynch.
“Those loans were made available at rock bottom interest rates – in many cases under 1 percent. And the loans could be continuously rolled over so they were effectively available for an average of about two years.”
You can read the Government Accountability Office (GAO) report on the matter here.
There has been far too little Congressional and media interest in why the Fed would pump $9 trillion of its $16 trillion in loans to just three Wall Street institutions. Those three institutions had one thing in common – they held massive amounts of margined trading accounts.
In December 2007, on the eve of the biggest Wall Street calamity since the Great Depression, margin debt on Wall Street stood at $322.8 billion according to data from the New York Stock Exchange. The latest data from the New York Stock Exchange shows that margin debt set a new historic record of $561.4 billion as of October 31, 2017.
The three Wall Street firms that Senator Elizabeth Warren called out for the obscene levels of largesse from the Federal Reserve are today operating their own Dark Pools – thinly regulated stock exchanges inside their own banks. Those dark pools are trading in Wall Street banking stocks as well as in shares of their very own bank stock.
According to the Senate hearings conducted after the stock market crash of 1929, it was illegal then under the National Bank Act for commercial banks to trade in their own stock. Ferdinand Pecora, Chief Counsel to the Senate Committee that conducted an investigation into the causes of the crash, told Hugh Baker, an officer of National City Bank, the precursor to today’s Citigroup: “You know that a bank under the law cannot trade in its own stock, don’t you.” Baker answered: “Yes, that is right.”
Unfortunately, today’s Securities and Exchange Commission (SEC) is wearing blinders about this brazen conflict of interest. At the time of his nomination by President Donald Trump to serve as SEC Chair, Jay Clayton, a law partner at the time with Sullivan & Cromwell, had represented eight of the ten largest Wall Street banks in the past three years – that included the banks trading their own stocks in their own Dark Pools. (It should be noted that the SEC was just as conflicted under the Obama administration.)
Whether this has led to price manipulations in the market is yet to be decisively determined. But there is certainly anecdotal evidence. For example, on May 20, 2015, the banking unit of Citigroup and JPMorgan Chase were charged with, and admitted to, a felony count for their involvement in the rigging of foreign exchange trading. In an efficient market, this would have sent the shares of both bank stocks on a downward spiral as it should have resulted in reputational damage, a loss of customer confidence, and potentially the loss of big institutional accounts that are prohibited from doing business with felons.
On the day before the announcement, May 19, Citigroup closed at $55.33. On the day of the announcement, Citigroup closed at $54.89. On the day after the announcement, Citigroup closed at $54.84. The closing prices for JPMorgan Chase on the same dates were: $67.01, $66.48, and $66.65. For the first time in their more than century-old existence, the banks became felons and it cost their share price less than 1 percent. To many minds, that’s not the workings of a fair and efficient market place.
On November 27, Robert Kaplan, the President of the Federal Reserve Bank of Dallas, called out a number of other problems he sees in this market. In addition to historic levels of margin debt, Kaplan highlighted the following: “U.S. stock market capitalization now stands at approximately 135 percent of GDP.” That’s the highest since the tech bubble of 1999 to March of 2000.
Kaplan also noted that it is “extraordinarily unusual” that the stock market has “gone 12 months without a 3 percent correction.” To put that further into perspective, this has been a year that a normal stock market would have climbed a wall of worry, if it climbed at all. The U.S. has experienced an unprecedented level of natural disasters in 2017 (hurricanes, flooding and wildfires) as the President’s poll numbers sank to historic lows and rhetoric out of North Korea brought constant fears about a nuclear warhead hitting a major U.S. city.
Kaplan added that market liquidity has come under pressure as “debt and equities securities trading volumes have markedly declined over the past several years.” Kaplan stated that New York Stock Exchange equity trading volume on average for 2017 is down 51 percent from 2007 levels.”
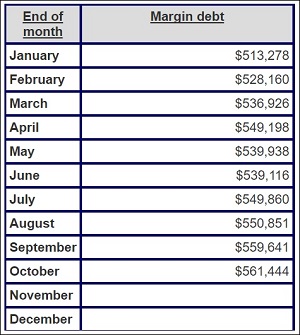
Margin Debt Growth in 2017. In Millions of Dollars. (Graphic Courtesy of New York Stock Exchange)