
By Pam Martens and Russ Martens: January 21, 2015
Television pundits and business writers who are relentlessly pounding the table on how cheaper home heating oil and gas at the pump is going to provide a consumer windfall and ramp up economic activity have a simplistic view of how things work.
Oil-related companies in the U.S. now account for between 35 to 40 percent of all capital spending. Announcements of sharp cutbacks in capital spending and job reductions by these companies create big ripples, forcing related companies to trim their own budgets, revenue assumptions, and payrolls accordingly.
The announcements coming out of the oil patch are picking up steam and it’s not a pretty picture. Last week Schlumberger said it would eliminate 9,000 jobs, approximately 7 percent of its workforce, and trim capital spending by about $1 billion. Yesterday, Baker Hughes, the oilfield services company, announced 7,000 in job cuts, roughly 11 percent of its workforce, and expects the cuts to all come in the first quarter. Baker Hughes also announced a 20 percent reduction in capital spending. This morning, the BBC is reporting that BHP Billiton will cut 40 percent of its U.S. shale operations, reducing its number of rigs from 26 to 16 by the end of June.
When Big Oil cuts capital spending, we’re not talking about millions of dollars or even hundreds of millions of dollars; we’re talking billions. Last month, ConocoPhillips announced it had set its capital budget for 2015 at $13.5 billion, a reduction of 20 percent. Smaller players are also announcing serious cutbacks. Yesterday Bonanza Creek Energy said it would cut its capital spending by 36 to 38 percent.
Other big industrial companies in the U.S. are also impacted by the sharp slump in oil, which has shaved almost 60 percent off the price of crude in just six months. As the oil majors scale back, it reduces the need for steel pipes. U.S. Steel has announced that it will lay off approximately 750 workers at two of its pipe plants.
On January 15, the Federal Reserve Bank of Kansas City released a dire survey of what’s ahead in its “Fourth Quarter Energy Survey.” The survey found: “The future capital spending index fell sharply, from 40 to -59, as contacts expected oil prices to keep falling. Access to credit also weakened compared to the third quarter and a year ago. Credit availability was expected to tighten further in the first half of 2015.” About half of the survey respondents said they were planning to cut spending by more than 20 percent while about one quarter of respondents expect cuts of 10 to 20 percent.
The impact of all of this retrenchment is not going unnoticed by sophisticated stock investors, as reflected in the major U.S. stock indices. On days when there is a notable plunge in the price of crude, the markets are following in lockstep during intraday trading. Yes, the broader stock averages continued to set new highs during the early months of the crude oil price decline in 2014 but that was likely due to the happy talk coming out of the Fed. It is also useful to recall that the Dow Jones Industrial Average traveled from 12,000 to 13,000 between March and May 2008 before entering a plunge that would take it into the 6500 range by March 2009.
Both the Federal Open Market Committee (FOMC) and Fed Chair Janet Yellen have assessed the plunge in oil prices as not of long duration. The December 17, 2014 statement from the FOMC and Yellen in her press conference the same day, characterized the collapse in energy prices as “transitory.” The FOMC statement said: “The Committee expects inflation to rise gradually toward 2 percent as the labor market improves further and the transitory effects of lower energy prices and other factors dissipate.”
If oil were the only industrial commodity collapsing in price, the Fed’s view might be more credible. Iron ore slumped 47 percent in 2014; copper has slumped to prices last seen during the height of the financial crisis in 2009. Other industrial commodities are also in decline.
A slowdown in both U.S. and global economic activity is also consistent with global interest rates on sovereign debt hitting historic lows as deflation takes root in a growing number of our trading partners. Despite the persistent chatter from the Fed that it plans to hike rates at some point this year, the yield on the U.S. 10-year Treasury note, a closely watched indicator of future economic activity, has been falling instead of rising. The 10-year Treasury has moved from a yield of 3 percent in January of last year to a yield of 1.79 percent this morning.
All of these indicators point to a global economy with far too much supply and too little demand from cash-strapped consumers. These are conditions completely consistent with a report out this week from Oxfam, which found the following:
“In 2014, the richest 1% of people in the world owned 48% of global wealth, leaving just 52% to be shared between the other 99% of adults on the planet. Almost all of that 52% is owned by those included in the richest 20%, leaving just 5.5% for the remaining 80% of people in the world. If this trend continues of an increasing wealth share to the richest, the top 1% will have more wealth than the remaining 99% of people in just two years.”
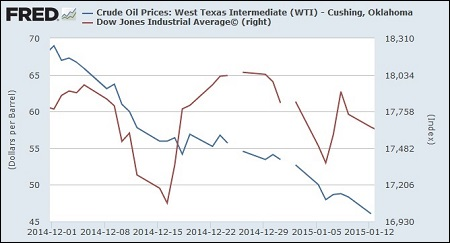
Crude Oil (WTI) Trading Versus the Dow Jones Industrial Average, December 1, 2014 Through January 12, 2015
