
By Pam Martens and Russ Martens: December 23, 2014
There is a mushrooming false narrative taking over the business airwaves: lower oil prices lead to lower prices at the pump which put more cash in consumers’ pockets which will lead to a more robust economy in the United States in 2015.
Yes, there are certainly lower prices at the pump. Yes, that gives consumers more disposable income. But it will decidedly not lead to a more robust economy in the United States for very long.
This isn’t a little speed bump in oil prices. This is one of the most dramatic and rapid crashes in a key industrial commodity in history. Since June, the price of West Texas Intermediate (WTI), the domestic crude oil produced in the U.S., is down by 47 percent. The price of the internationally traded crude oil, Brent, is down by a similar figure.
If this price collapse were happening in just crude oil, it could be shrugged off as a supply glut problem attributable to growing shale production in the U.S. and over production among OPEC members. But other industrial commodities are in freefall as well. Iron ore prices are down 49 percent this year while copper has declined 15 percent. The price of natural gas is down 30 percent in just the past month, including a plunge of 9 percent just yesterday.
Data from the Bureau of Labor Statistics shows that a broad gauge of industrial commodity prices entered a gradual decline in June and then began to plunge in September. That chart looks suspiciously similar to the price action in industrial commodities in the same time period in 2008 – which signaled an early warning to the greatest economic collapse in the United States since the Great Depression. (See charts below.)
Industrial commodity prices are a leading indicator of things that are more than pesky details to economic stability. A robust manufacturing sector and robust consumer demand is simply not compatible with crashing industrial commodity prices.
Plunging industrial commodity prices are compatible with the sharp decline in the interest rate on the 10-year U.S. Treasury note and the fact that yields on similar maturity sovereign debt in Germany, Italy, Austria, Belgium, Finland, France and Ireland set all-time lows this month.
You are no doubt thinking by now that the U.S. stock market is also supposed to be a reliable barometer of economic vitality – looking out on the horizon by about six months.
Sorry. You’re confusing the stock market barometer of yesteryear with today’s cacophony coming from high frequency traders, artificial intelligence algorithms, co-located computers, dark pools, and over $1 trillion in corporations buying back their own stock. It might be helpful to remember that the Dow Jones Industrial Average went from 12,000 to 13,000 between March and May of 2008 before entering a plunge that would take it to the 6500 range by March of 2009. (It should be noted, however, that frothy markets can become frothier than the current one before reality sets in.)
Federal Reserve Chair, Janet Yellen, has climbed out on a very precarious limb in this debate. Both the December 17, 2014 statement from the Federal Open Market Committee (FOMC) and Yellen in her press conference that day, characterized the collapse in energy prices as “transitory.” The FOMC statement read: “The Committee expects inflation to rise gradually toward 2 percent as the labor market improves further and the transitory effects of lower energy prices and other factors dissipate.” Nothing about the charts below gives an impression of “transitory” conditions.
Not everyone at the Federal Reserve is part of the happy clatter crowd. On October 13, 2014, Chicago Fed President, Charles Evans, spoke before the annual conference of the National Council on Teacher Retirement in Indianapolis. Evans expressed skepticism that an economy can be robust with the tepid growth in wages happening in the United States. Evans stated:
“…it is hard to imagine a robust labor market without solid growth in wages. With productivity growth of around 1 to 2 percent and an inflation target of around 2 percent, we should be seeing wages and benefits rising at around a 3 to 4 percent rate. But that is clearly not the case. Although some in-demand occupations may be experiencing stronger wage growth, overall compensation growth has been around 2 percent over the past six years. Taken altogether, these and other measures lead me to conclude that there remains significant underutilization of labor resources — and likely somewhat more slack than what is indicated by the unemployment rate alone.”
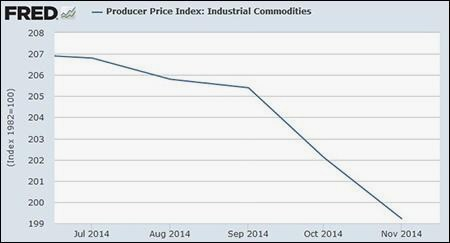
Producer Price Index — Industrial Commodities, July through November 2014 (Graph courtesy of the Federal Reserve Bank of St. Louis; data from Bureau of Labor Statistics)
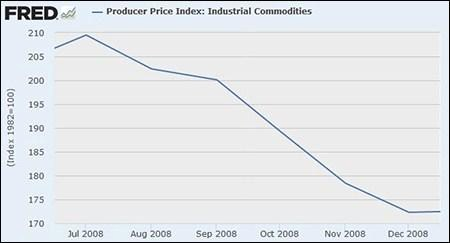
Producer Price Index — Industrial Commodities, July through December 2008 (Graph courtesy of the Federal Reserve Bank of St. Louis; data from Bureau of Labor Statistics.)
