
By Pam Martens: October 28, 2014
 Yesterday the Wall Street Journal gave prominence to the following headline on page one of its newspaper with the story jumping to page A2: “Bad Market Timing Fueled Wealth Gap.” Through the use of the word “fueled” in that headline, the reader is conditioned to believe that market timing is a significant cause of wealth inequality in the United States – a completely bogus idea for which there exists mountains of research to the contrary.
The online version of the article includes a video interview with the author, Josh Zumbrun, and this caption appears under the video: “Millions of Americans bought high and sold low, which caused them to unknowingly widen economic inequality. WSJ’s Josh Zumbrun explains on MoneyBeat with Paul Vigna.”
The crux of this thesis is built in the first three paragraphs of the article as follows:
“Millions of Americans inadvertently made a classic investment mistake that contributed to today’s widening economic inequality: They bought high and sold low.
“Late in the stock-market booms of the 1990s and 2000s, more U.S. families clambered into stocks as indexes surged. Then, once markets tumbled, many households sold and took losses.
“Those that held on during the most recent collapses reaped the benefits as stocks nearly tripled between 2009 and today.”
Only much later in the article does the author offer up this bit of clarification:
“Wealth inequality in the U.S. has many causes, some of which precede the recent booms and busts, and the new research doesn’t quantify exactly how much the stock-market timing contributed to it.”
“Doesn’t quantify exactly how much”? But your front page headline said market timing “fueled” the wealth gap. The Wall Street Journal couldn’t possibly be engaging in propaganda could it?
The absurdity that buying high and selling low fueled wealth inequality in the United States is firmly established in the data from decades of the Federal Reserve’s Survey of Consumer Finances (SCF) indicating that the vast majority of American households don’t even own stocks. According to the 2007 SCF, the year before the 2008 financial crash, only 17.9 percent of American households owned stocks.
The Federal Reserve’s 2007 SCF has this to say on the subject:
“The share of families with any such stock holdings declined 2.8 percentage points from 2004 to 2007, to 17.9 percent, thereby continuing a decline observed over the previous three-year period.”
By 2010, the SCF reports that the number of households holding stocks had declined to 15.1 percent – a measly difference of 2.8 percent, which certainly is insufficient to make a case that large numbers of people had sold at the bottom and fueled wealth inequality. In fact, the 2.8 percent ownership shrinkage is the identical percentage decline that happened between 2004 and 2007, according to the Federal Reserve. From September 2004 to September 2007, the Wilshire 5000 index – a broad based index of stock performance – rose 41.7 percent.
In other words, during periods of significant stock price increases and stock price decreases, there was an identical percentage decline of 2.8 percent in households’ ownership of stocks.
Much more relevant to a correlation between stock ownership and widening wealth inequality is the asset stripping nature of 401(k) plans – part of Wall Street’s institutionalized wealth transfer system.
On April 23, 2013, Frontline producer Martin Smith exposed the following with charts and graphs and interviews: If you work for 50 years and receive the typical long-term return of 7 percent on your 401(k) plan and your fees are 2 percent, almost two-thirds of your account will go to Wall Street. The program was titled The Retirement Gamble.
As we wrote at the time, “This is not so much a gamble as a certainty: under a 2 percent 401(k) fee structure, almost two-thirds of your working life will go toward paying obscene compensation to Wall Street; a little over one-third will benefit your family – and that’s before paying taxes on withdrawals to Uncle Sam.” (You can read our detailed dissection of the program and the math here.)
The same Wall Street banks that are enabled by Congress to asset strip 401(k)s are the very same banks that asset-stripped the equity in the little guys’ homes through illegal foreclosures and mortgage fraud and then were allowed to decide on their own how much to pay their victims.
According to Senator Elizabeth Warren in a Senate hearing on April 11, 2013, at least 3,949,896 families suffered the following types of foreclosure or mortgage frauds at the hands of Wall Street banks: members of the military who were protected under Federal Law had their homes illegally foreclosed; families who were current on their payments had their homes illegally foreclosed; people who were performing all of their requirements under a loan modification were illegally foreclosed.
The Wall Street Journal piece focuses on just wealth inequality but that can’t be addressed properly without looking at what has simultaneously caused unprecedented income inequality in our nation. No one has done a better job in delivering a well documented and easy to digest analysis of this topic than Robert Reich in his film, “Inequality for All.”
The film explains that after World War II, and for decades thereafter, the income of the middle class climbed steadily. Then, in the late 70s, the upward march abruptly stopped. For the next three decades, adjusted for inflation, middle class incomes stagnated.
To meet growing expenses, women left the home and joined the workforce. Then the middle class began to work longer hours. Still unable to meet the growing living costs, the middle class took on ever greater levels of debt – especially home equity loans, as their one major asset grew in value.
A companion problem was that the number of people represented by unions fell from one-third of all workers to a stunning 7 percent. The ability of workers to negotiate for higher wages, and set a higher standard for all wage earners, was crushed with the decimation of unions.
Additionally, perhaps most importantly, is the parallel between the income inequality that existed just before the two most epic stocks market crashes in our nation’s history: the crash of 1929 and 2008. In the year before each of those crashes, income inequality had reached an historic peak. Why did this only occur at those two moments in our history? Because, in 1929, Wall Street banks were allowed to collect deposits from savers and use the money to make wild speculations on Wall Street. From 1933 to 1999, that activity was curtailed by the Glass-Steagall Act. The Clinton administration repealed the Glass-Steagall Act in 1999, allowing trillions of savers deposits to be concentrated in a handful of the largest Wall Street banks – which pay miniscule interest to the depositors while reaping outsized gains in risky market speculations.
If the bets payoff, the banks keep the winnings and pay obscene salaries and bonuses to their executives and traders. If the bets fail spectacularly, the taxpayers bail out the bank. This is our heads they win, tails you lose current system. To attempt to dress all of this up as bad market timing on the part of the little guy is about as low as it gets.
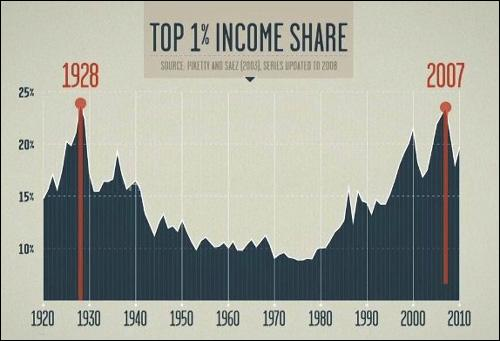
Income Inequality Graph from Robert Reich’s Film, “Inequality for All”
