
By Pam Martens and Russ Martens: September 24, 2014
If there’s a bull market on Wall Street, somebody forgot to tell the small caps. The Russell 2000 index that measures the performance of smaller capitalized companies is down 3 percent this year versus the big capitalized companies in Standard and Poor’s 500 – which is up 8.9 percent year-to-date through the close yesterday.
This divergence is a worrisome sign for those who look at historical charts. It becomes even more problematic when combined with the recent news that a good chunk of the buoyancy in the S&P 500 is coming from these big corporations spending billions to buy back their own stock – sometimes in unregulated dark pools operated by global banks on Wall Street.
Clearly, smaller companies can’t borrow tens of billions in the debt markets in order to plow it into their own share repurchase programs. As we reported in July, in 2013 corporations authorized $754.8 billion in stock buybacks while simultaneously borrowing $782.5 billion from credit markets. According to Jeffrey Kleintop, Chief Market Strategist for LPL Financial, big corporations are now the single largest buying source for all U.S. stocks.
Last week, the Wall Street Journal cited data from Birinyi Associates showing that U.S. companies have continued the buyback trend this year, repurchasing their own shares to the tune of $338.3 billion in the first six months of this year — “the most for any six-month period since 2007,” the year before the biggest crash since the Great Depression.
If big company money is underpinning the upward trajectory of the S&P 500 while the broad market in thousands of other companies’ share prices fail to confirm this bullish sentiment, it’s tough to make the case for a robust, sustainable bull market.
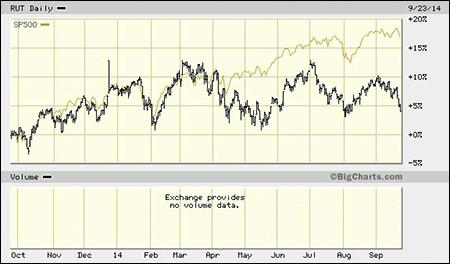
Russell 2000 Versus S&P 500 Past 12 Months (www.BigCharts.com)
Then there is the problem of overall market breadth – the number of stocks advancing versus the number declining. Last week, the New York Stock Exchange had 1604 stocks advancing versus 1622 declining. Nasdaq, for the same period, had 1093 advancers versus 1742 decliners.
New highs versus new lows on Nasdaq are also sounding alarms. Last week, 307 Nasdaq stocks set new highs while 433 set new lows.
The serious downward draft in commodity prices is also flashing another warning signal. Deflating commodity prices are not compatible with a global economic growth story that would sustain a legitimate bull market in corporate stock prices.
Iron ore has now slumped 41 percent this year, marking a five-year low. In just the third quarter the price is off by 15 percent, suggesting the trend remains in place. This week the price broke $80 a dry ton for the first time since 2009.
Agricultural commodity prices are also confirming the trend with corn off 22 percent since June and wheat down 16 percent in the same period. Soybean prices are down 28 percent this year to the lowest in four years.
Deflationary winds blowing in from Europe, cooling economic growth in China, together with the question of just how disfigured the stock market has become as a result of $1.09 trillion propping up the S&P 500 through corporate buybacks in the last 18 months, all signal one word for the average investor: caution.
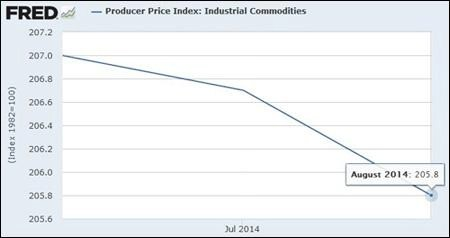
Producer Price Index — Industrial Commodities, June to August 2014; Chart from Federal Reserve Bank of St. Louis
