By Pam Martens and Russ Martens: July 21, 2021 ~
The only time that tens of millions of Americans typically hear anything about the stock market on the evening news is when the S&P 500 Index sets a new high. That’s been happening a lot this year. For example, on June 30 it was widely reported that the S&P 500 had clinched its sixth record close for the year.
But beneath the surface of that cheerful sound bite, major deterioration in the underpinnings of the market has been taking place. For example, recently there have been more stocks on the New York Stock Exchange setting 3-month lows than setting three-month highs. The same is true for the Nasdaq stock market and dramatically so for the smaller companies that trade Over-the-Counter (OTC). These measurements gauge the “breadth of the market.” When new lows consistently trounce new highs, it can be a forewarning of a looming market correction.
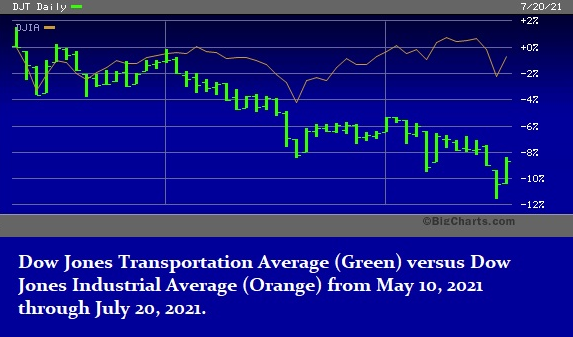
Then there is the problem with the Dow Theory breaking down. Based on that theory, any long-term uptrend in the overall market requires that both the Dow Jones Industrial Average and the Dow Jones Transportation Average set new highs within a reasonable period of time of each other to confirm the upward trend. The thinking goes that if industrials are doing well, then the companies that ship those industrial products, the transports, should also be doing well. But as the chart above indicates, since May 10, the bottom has been falling out of the transports as the Dow Jones Industrial Average experienced little damage.
Next up is the yield on the bellwether 10-year U.S. Treasury note. While the financial media has been in a tizzy over the threat of inflation coming from an overheating economy, the yield on the 10-Year Treasury note has been behaving like a recession is just around the corner. Since April 1, the yield on the 10-year U.S. Treasury note has declined from 1.70 percent to a yield of 1.2 percent.
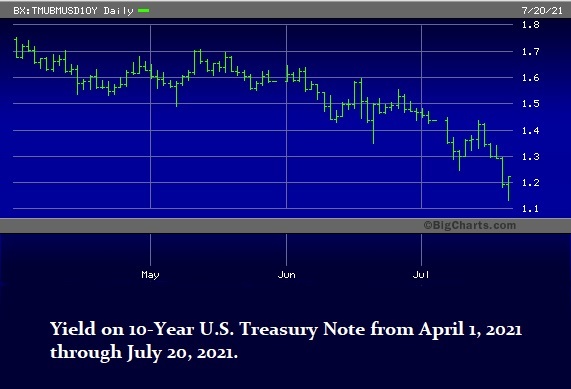
Unfortunately, we can’t tell if that heretofore bellwether on the U.S. economy is still an accurate barometer because the Fed has completely distorted the normal functioning of this market. James Grant calls what the Fed is doing “administered rates.” We agree.
The confusion over just where the yield should be on the 10-Year U.S. Treasury note stems from the fact that the Federal Reserve continues to buy up approximately $80 billion each month in Treasury bills, notes and bonds. The Fed uses the quaint expression for this process as “Quantitative Easing” or QE. In reality, the Fed is providing artificial demand for these Treasury securities that wouldn’t otherwise be there, and thus driving down the yield.
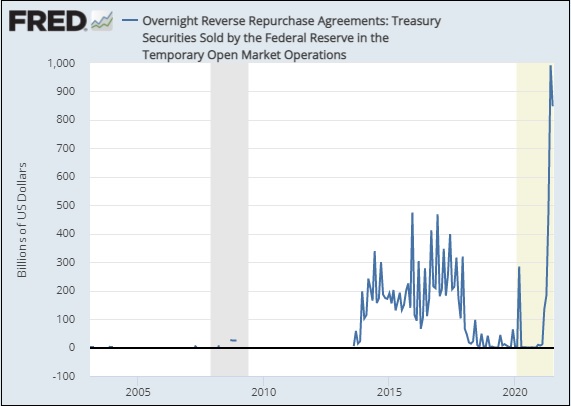
On top of that artificial demand, the Federal Reserve, via the privately-owned New York Fed, is simultaneously engaging in reverse repurchase agreements (reverse repos or RRPs) with the trading houses on Wall Street (primary dealers) and other financial institutions. A reverse repo is where these trading houses and financial institutions buy Treasury securities from the New York Fed on an overnight or short-term basis. The reverse repo operation at the New York Fed has grown from zero at the beginning of the year; to over $200 billion a day in May; to over $800 billion a day by late June. This month, we continue to see daily RRPs of more than $800 billion.
The chart below, based on RRP data from the St. Louis Fed, shows the unprecedented scale of these RRP operations.
In simple terms, what the Federal Reserve has been doing since its $29 trillion Wall Street bailout program that ran secretly from 2007 through at least July of 2010, is to flood Wall Street with bailout money and then, after the fact, attempt to figure out how to deal with the bubbles and market dislocations these bailouts create. For the past 13 years it’s been like watching a mad scientist perform radical experiments on a financial system controlled by Frankenbanks, the Wall Street behemoths that were insanely allowed by Congress to merge federally-insured deposits with high-risk speculative trading via the repeal of the Glass-Steagall Act in 1999.